
Videos
Internal Business Process Performance Measures
Tombro Industries is in the process of automating one of its plants and developing a flexible manufacturing system. The company is finding it necessary to mate many changes in operating procedures. Progress has been slow, particularly in trying to develop new performance measures for the factory.
In an effort to evaluate performance and determine where improvements can be made, management has gathered the following data relating to activities over the last four months: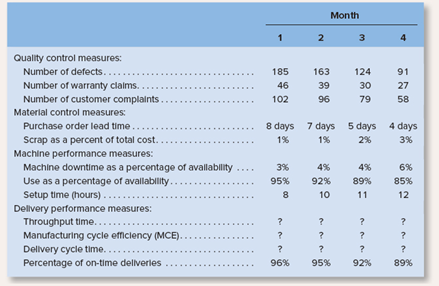
The president has read in industry journals that throughput time: MCE and delivery cycle time are important measures of performance, but no one is sure how they are computed. You have been asked to assist the company, and you have gathered the following data relating to these measures: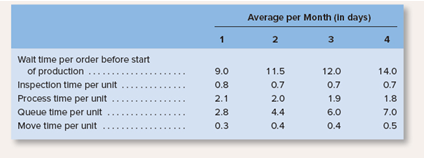
Required:
1. For each month compute the following performance measures:
a. Throughput time.
b. MCE.
c. Delivery cycle time.
2. Using the performance measures given in the main body of the problem and the performance measures computed in (1) above, do the following:
a. Identify areas where the company seems to be improving.
b. Identify areas where the company seems to be deteriorating.
3. Refer to the inspection time, process time, and so forth, given for month 4.
a. Assume that in month 5 the inspection time, process time, and so forth, are the same as for month 4. except that the company is able to completely eliminate the queue time during production using Lean Production. Compute the new throughput time and MCE.
b. Assume that in month 6 the inspection time, process time, and so forth, are the same as in month 4, except that the company is able to eliminate both the queue time during production and the inspection time using Lean Production. Compute the new throughput time and MCE.
1)
Delivery Cycle, Throughput Time, Manufacturing Cycle Efficiency:
The time taken from the start of the sale process, i.e. the receipt of a confirmed sales order, to the completion of the transfer of goods or services, i.e. dispatch of goods is known as the Delivery Cycle.
It consists of throughput time, Value added time and non-value added time.
To depict delivery cycle in the formula form, the following formula maybe used:
Delivery Cycle = Value added Elements of Throughput Time + Non Value Added Elements of Throughput Time.
Manufacturing Cycle Efficiency is an internal business performance parameter with respect to manufacturing processes and industries. It measures the total time taken by value added activities in relation to the throughput time.
- Throughput Time
- Delivery Cycle
- Manufacturing Cycle Efficiency
Answer to Problem 19P
Solution:
| Average Time per month (in days) | ||||
| Particulars | 1 | 2 | 3 | 4 |
| Throughput Time | 7.30 | 8.10 | 8.80 | 9.60 |
| Delivery Cycle | 16.30 | 19.60 | 20.80 | 23.60 |
| Manufacturing Cycle Efficiency | 0.29 | 0.25 | 0.22 | 0.19 |
Explanation of Solution
- Throughput time comprises of two main categories of elements i.e. Value added and Non Value added elements.
- Value added elements refer to the time taken for those activities that add quality and value to the overall production process concerning manufacture of goods. Example − Process Time.
- Process time is the time spent on actually producing the product. It refers to the time taken to convert the goods from raw materials to interim or final finished products
- Non Value added elements refer to the time taken for those activities that do not add quality and value to the overall production process concerning manufacture of goods and that need to be eliminated to the greatest extent possible. Example - Inspection Time, Move Time and Queue time
- Inspection time is the amount of time spent assuring that the product is defect free to the best possible extent
- Move time is the time required to transfer raw materials or interim or final finished products from one location to another, such as factory to job workers’ location.
- Queue time is the amount of time that is spent waiting for the actually production activities to commence since other products are being produced or worked upon.
- Given:
| Average Time per month (in days) | ||||
| Particulars | 1.0 | 2.0 | 3.0 | 4.0 |
| Move time per unit | 0.3 | 0.4 | 0.4 | 0.5 |
| Process Time per unit | 2.1 | 2.0 | 1.9 | 1.8 |
| Wait time per order | 9.0 | 11.5 | 12.0 | 14.0 |
| Queue Time per unit | 4.3 | 5.0 | 5.8 | 6.7 |
| Inspection Time per unit | 0.6 | 0.7 | 0.7 | 0.6 |
- Formulas Used:
- Total Throughput Time = Time Taken by value added activities + Time Taken by Non value added activities (Except Wait Time)
- Delivery Cycle = Non Value Added activities + Total Throughput Time
- Manufacturing cycle efficiency = Time Taken by value added activities / Total Throughput Time.
- Time Taken by value added activities = Time taken for Process Time
- Time Taken by Non value added activities = Time taken for Move Time + Queue Time + Inspection Time
- Calculations:
| Average Time per month (in days) | ||||
| Particulars | 1.0 | 2.0 | 3.0 | 4.0 |
| Move time per unit | 0.3 | 0.4 | 0.4 | 0.5 |
| Queue Time per unit | 4.3 | 5.0 | 5.8 | 6.7 |
| Inspection Time per unit | 0.6 | 0.7 | 0.7 | 0.6 |
| Total Time For Non Value Added Activities (A) | 5.2 | 6.1 | 6.9 | 7.8 |
| Process Time per unit | 2.1 | 2.0 | 1.9 | 1.8 |
| Total Time For Non Value Added Activities (B) | 2.1 | 2.0 | 1.9 | 1.8 |
| Throughput Time (A+B) [C] | 7.3 | 8.1 | 8.8 | 9.6 |
| Wait time per order [D] | 9.0 | 11.5 | 12.0 | 14.0 |
| Delivery Cycle (C+D) | 16.3 | 19.6 | 20.8 | 23.6 |
| Manufacturing Cycle Efficiency | Time Taken by value added activities / Total Throughput Time. | |||
| Manufacturing Cycle Efficiency | 0.29 | 0.25 | 0.22 | 0.19 |
Hence the throughput time, delivery cycle, and manufacturing cycle efficiency has been calculated for each months.
2)
Evaluation of Manufacturing Cycle efficiency and its’ components
The time taken from the start of the sale process, i.e. the receipt of a confirmed sales order, to the completion of the transfer of goods or services, i.e. dispatch of goods is known as the Delivery Cycle.
It consists of throughput time, Value added time and non-value added time.
To depict delivery cycle in the formula form, the following formula maybe used:
Delivery Cycle = Value added Elements of Throughput Time + Non Value Added Elements of Throughput Time.
Manufacturing Cycle Efficiency is an internal business performance parameter with respect to manufacturing processes and industries. It measures the total time taken by value added activities in relation to the throughput time.
Hence evaluation has to be done of the following parameters:
- Throughput time
- Delivery Cycle Time
- Manufacturing Cycle Efficiency
- Areas where company’s performance is improving.
- Areas where company’s performance is deteriorating.
Answer to Problem 19P
Solution:
- Areas where company’s performance is improving are None
- Areas where company’s performance is deteriorating are throughput time and delivery cycle time and manufacturing cycle efficiency.
Explanation of Solution
- Throughput time comprises of two main categories of elements i.e. Value added and Non Value added elements.
- Value added elements refer to the time taken for those activities that add quality and value to the overall production process concerning manufacture of goods. Example − Process Time.
- Non Value added elements refer to the time taken for those activities that do not add quality and value to the overall production process concerning manufacture of goods and that need to be eliminated to the greatest extent possible. Example - Inspection Time, Move Time and Queue time
- Following are the Throughput time for four months:
| Average Time per month (in days) | ||||
| Particulars | 1 | 2 | 3 | 4 |
| Throughput Time | 7.30 | 8.10 | 8.80 | 9.60 |
- Since the total throughput time is increasing, it can be said the company’s performance is deteriorating.
- The time taken from the start of the sale process, i.e. the receipt of a confirmed sales order, to the completion of the transfer of goods or services, i.e. dispatch of goods is known as the Delivery Cycle.
- Following are the Delivery cycle times for four months:
| Average Time per month (in days) | ||||
| Particulars | 1 | 2 | 3 | 4 |
| Delivery Cycle | 16.30 | 19.60 | 20.80 | 23.60 |
- Since the total delivery cycle time is increasing, it can be said the company’s performance is deteriorating.
- Manufacturing cycle efficiency helps keep track of where time and cost is incurred in non-value added activities and performance efficiency measurement.
- Manufacturing cycle efficiency is denoted by the following formula:
Manufacturing cycle efficiency = Time Taken by value added activities / Total Throughput Time.
Total Throughput Time = Time Taken by value added activities + Time Taken by Non value added activities
- For example if the time Taken by value added activities is 25 minutes per unit and the Time Taken by non-value added activities is 35 minutes then manufacturing cycle efficiency would be 0.42.
- Thus it can be interpreted as, the value added activities take up only 42 % of the total time taken to complete the manufacturing process and the rest is attributable to non-value added activities.
| Average Time per month (in days) | ||||
| Particulars | 1 | 2 | 3 | 4 |
| Manufacturing Cycle Efficiency | 0.29 | 0.25 | 0.22 | 0.19 |
- Since the Manufacturing Cycle Efficiency is decreasing, the company’s performance is deteriorating.
Hence the performance measures where the company’s performance is increasing and decreasing are enumerated.
3)
a)
Throughput Time, Manufacturing Cycle Efficiency
The time taken from the start of the sale process, i.e. the receipt of a confirmed sales order, to the completion of the transfer of goods or services, i.e. dispatch of goods is known as the Delivery Cycle.
It consists of throughput time, Value added time and non-value added time.
To depict delivery cycle in the formula form, the following formula maybe used:
Delivery Cycle = Value added Elements of Throughput Time + Non Value Added Elements of Throughput Time.
Manufacturing Cycle Efficiency is an internal business performance parameter with respect to manufacturing processes and industries. It measures the total time taken by value added activities in relation to the throughput time.
- Throughput Time for Month 5
- Manufacturing Cycle Efficiency for Month 5
Answer to Problem 19P
Solution:
| Average Time per month (in days) | ||
| Particulars | 4 | 5 |
| Throughput Time | 9.60 | 2.90 |
| Manufacturing Cycle Efficiency for month 5 | 0.19 | 0.62 |
Explanation of Solution
- Throughput time comprises of two main categories of elements i.e. Value added and Non Value added elements.
- Value added elements refer to the time taken for those activities that add quality and value to the overall production process concerning manufacture of goods. Example − Process Time.
- Process time is the time spent on actually producing the product. It refers to the time taken to convert the goods from raw materials to interim or final finished products
- Non Value added elements refer to the time taken for those activities that do not add quality and value to the overall production process concerning manufacture of goods and that need to be eliminated to the greatest extent possible. Example - Inspection Time, Move Time and Queue time
- Inspection time is the amount of time spent assuring that the product is defect free to the best possible extent
- Move time is the time required to transfer raw materials or interim or final finished products from one location to another, such as factory to job workers’ location.
- Queue time is the amount of time that is spent waiting for the actually production activities to commence since other products are being produced or worked upon.
- Given:
| Particulars | 4 | 5 |
| Move time per unit | 0.5 | 0.5 |
| Queue Time per unit | 6.7 | 0.0 |
| Inspection Time per unit | 0.6 | 0.6 |
| Process Time per unit | 1.8 | 1.8 |
- Total Throughput Time = Time Taken by value added activities + Time Taken by Non value added activities (Except Wait Time)
- Manufacturing cycle efficiency = Time Taken by value added activities / Total Throughput Time.
- Time Taken by value added activities = Time taken for Process Time
- Time Taken by Non value added activities = Time taken for Move Time + Queue Time + Inspection Time
- Calculations:
| Average Time per month (in days) | ||
| Particulars | 4 | 5 |
| Move time per unit | 0.5 | 0.5 |
| Queue Time per unit | 6.7 | 0.0 |
| Inspection Time per unit | 0.6 | 0.6 |
| Total Time For Non Value Added Activities (A) | 7.8 | 1.1 |
| Process Time per unit | 1.8 | 1.8 |
| Total Time For Value Added Activities (B) | 1.8 | 1.8 |
| Throughput Time (A+B) [C] | 9.6 | 2.9 |
| Manufacturing Cycle Efficiency | Time Taken by value added activities / Total Throughput Time. | |
| Manufacturing Cycle Efficiency | 0.19 | 0.62 |
Hence the throughput time and manufacturing cycle efficiency has been calculated for month 5.
3)
b)
Throughput Time, Manufacturing Cycle Efficiency
The time taken from the start of the sale process, i.e. the receipt of a confirmed sales order, to the completion of the transfer of goods or services, i.e. dispatch of goods is known as the Delivery Cycle.
It consists of throughput time, Value added time and non-value added time.
To depict delivery cycle in the formula form, the following formula maybe used:
Delivery Cycle = Value added Elements of Throughput Time + Non Value Added Elements of Throughput Time.
Manufacturing Cycle Efficiency is an internal business performance parameter with respect to manufacturing processes and industries. It measures the total time taken by value added activities in relation to the throughput time.
- Throughput Time for Month 6
- Manufacturing Cycle Efficiency for Month 6
Answer to Problem 19P
Solution:
| Average Time per month (in days) | ||
| Particulars | 4 | 6 |
| Throughput Time | 9.60 | 2.30 |
| Manufacturing Cycle Efficiency for month 6 | 0.19 | 0.78 |
Explanation of Solution
- Throughput time comprises of two main categories of elements i.e. Value added and Non Value added elements.
- Value added elements refer to the time taken for those activities that add quality and value to the overall production process concerning manufacture of goods. Example − Process Time.
- Process time is the time spent on actually producing the product. It refers to the time taken to convert the goods from raw materials to interim or final finished products
- Non Value added elements refer to the time taken for those activities that do not add quality and value to the overall production process concerning manufacture of goods and that need to be eliminated to the greatest extent possible. Example - Inspection Time, Move Time and Queue time
- Inspection time is the amount of time spent assuring that the product is defect free to the best possible extent
- Move time is the time required to transfer raw materials or interim or final finished products from one location to another, such as factory to job workers’ location.
- Queue time is the amount of time that is spent waiting for the actually production activities to commence since other products are being produced or worked upon.
- Given:
| Particulars | 4 | 6 |
| Move time per unit | 0.5 | 0.5 |
| Queue Time per unit | 6.7 | 0.0 |
| Inspection Time per unit | 0.6 | 0.0 |
| Process Time per unit | 1.8 | 1.8 |
- Total Throughput Time = Time Taken by value added activities + Time Taken by Non value added activities (Except Wait Time)
- Manufacturing cycle efficiency = Time Taken by value added activities / Total Throughput Time.
- Time Taken by value added activities = Time taken for Process Time
- Time Taken by Non value added activities = Time taken for Move Time + Queue Time + Inspection Time
- Calculations:
| Average Time per month (in days) | ||
| Particulars | 4 | 6 |
| Move time per unit | 0.5 | 0.5 |
| Queue Time per unit | 6.7 | 0.0 |
| Inspection Time per unit | 0.6 | 0.0 |
| Total Time For Non Value Added Activities (A) | 7.8 | 0.5 |
| Process Time per unit | 1.8 | 1.8 |
| Total Time For Value Added Activities (B) | 1.8 | 1.8 |
| Throughput Time (A+B) [C] | 9.6 | 2.3 |
| Manufacturing Cycle Efficiency | Time Taken by value added activities / Total Throughput Time. | |
| Manufacturing Cycle Efficiency | 0.19 | 0.78 |
Hence the throughput time and manufacturing cycle efficiency has been calculated for month 6.
Want to see more full solutions like this?
Chapter 10 Solutions
INTRO TO MANAGERIAL ACCT-CONNECT ACCESS


- DataSpan, Inc., automated its plant at the start of the current year and installed a flexible manufacturing system. The company is also evaluating its suppliers and moving toward Lean Production. Many adjustment problems have been encountered, including problems relating to performance measurement. After much study, the company has decided to use the performance measures below, and it has gathered data relating to these measures for the first four months of operations. Month 1 2 3 4 Throughput time (days) ? ? ? ? Delivery cycle time (days) ? ? ? ? Manufacturing cycle efficiency (MCE) ? ? ? ? Percentage of on-time deliveries 78 % 73 % 70 % 67 % Total sales (units) 2330 2230 2116 2036 Management has asked for your help in computing throughput time, delivery cycle time, and MCE. The following average times have been logged over the last four months: Average per Month (in days) 1 2 3 4 Move time per unit 0.8…arrow_forwardSubject - account Please help me. Thankyou.arrow_forwardNeed the correct answersarrow_forward
- Please helparrow_forwardplease complete entirelyarrow_forwardIn response to intensive foreign competition, the management of Florex Company has attempted over the past year to improve the quality of its products. A statistical process control system has been installed and other steps have been taken to decrease the amount of warranty and other field costs, which have been trending upward over the past several years. Costs relating to quality and quality control over the last two years are given below: Inspection Quality engineering Depreciation of test equipment Rework labor Statistical process control Cost of field servicing Supplies used in testing Systems development Warranty repairs Costs (in thousands) Last Year This Year $ 660 $ 1,215 $ 300 $ 600 $ 300 $ 225 $ 900 $ 0 $ 300 $ 1,200 $ 30 $ 1,500 $ 1,050 $ 60 $ 750 Net cost of scrap Product testing ces Product recalls Disposal of defective products $ 900 $ 3,375 $ 450 $ 1,110 $ 2,625 $ 1,350 $ 900 $ 1,350 $ 750 $ 750 $ 750 Sales have been flat over the past few years, at $75,000,000 per…arrow_forward
- In response to intensive foreign competition, the management of Florex Company has attempted over the past year to improve the quality of its products. A statistical process control system has been installed and other steps have been taken to decrease the amount of warranty and other field costs, which have been trending upward over the past several years. Costs relating to quality and quality control over the last two years are given below: Inspection Quality engineering Depreciation of test equipment Rework labor Statistical process control Cost of field servicing Supplies used in testing Systems development Warranty repairs Net cost of scrap Product testing Product recalls Disposal of defective products Costs (in thousands) Last Year This Year $ 1,092 $ 42 $ 840 $ 1,218 $ 420 $ 630 $ 630 $ 420 $ 1,260 $ 0 $ 1,680 $ 210 $ 1,260 $ 42 $ 840 $ 840 $ 1,344 $ 420 $ 1,008 $ 2,100 $ 1,260 $ 1,260 $ 924 $ 840 $ 840 $ 3,780 Sales have been flat over the past few years, at $84,000,000 per…arrow_forwardDogarrow_forwardThe management of International Cookwares believes that delivery performance measures must be improved if the company is to maintain its competitive edge. The following data are considered to be typical of the time to complete orders. • Process time: 4 days • Wait time to the start of production: 15 days • Move time: 3 days ● Inspection time: 2 days • Queue time during the production process: 8 days What is the delivery cycle time?arrow_forward
- Recently, Ulrich Company received a report from an external consulting group on its quality costs. The consultants reported that the companys quality costs total about 21 percent of its sales revenues. Somewhat shocked by the magnitude of the costs, Rob Rustin, president of Ulrich Company, decided to launch a major quality improvement program. For the coming year, management decided to reduce quality costs to 17 percent of sales revenues. Although the amount of reduction was ambitious, most company officials believed that the goal could be realized. To improve the monitoring of the quality improvement program, Rob directed Pamela Golding, the controller, to prepare monthly performance reports comparing budgeted and actual quality costs. Budgeted costs and sales for the first two months of the year are as follows: The following actual sales and actual quality costs were reported for January: Required: 1. Reorganize the monthly budgets so that quality costs are grouped in one of four categories: appraisal, prevention, internal failure, or external failure. (Essentially, prepare a budgeted cost of quality report.) Also, identify each cost as variable (V) or fixed (F). (Assume that no costs are mixed.) 2. Prepare a performance report for January that compares actual costs with budgeted costs. Comment on the companys progress in improving quality and reducing its quality costs.arrow_forwardSuppose that Kicker had the following sales and cost experience (in thousands of dollars) for May of the current year and for May of the prior year: In May of the prior year, Kicker started an intensive quality program designed to enable it to build original equipment manufacture (OEM) speaker systems for a major automobile company. The program was housed in research and development. In the beginning of the current year, Kickers accounting department exercised tighter control over sales commissions, ensuring that no dubious (e.g., double) payments were made. The increased sales in the current year required additional warehouse space that Kicker rented in town. (Round ratios to four decimal places. Round sales dollars computations to the nearest dollar.) Required: 1. Calculate the contribution margin ratio for May of both years. 2. Calculate the break-even point in sales dollars for both years. 3. Calculate the margin of safety in sales dollars for both years. 4. CONCEPTUAL CONNECTION Analyze the differences shown by your calculations in Requirements 1, 2, and 3.arrow_forwardIn 20x5, Major Company initiated a full-scale, quality improvement program. At the end of the year, Jack Aldredge, the president, noted with some satisfaction that the defects per unit of product had dropped significantly compared to the prior year. He was also pleased that relationships with suppliers had improved and defective materials had declined. The new quality training program was also well accepted by employees. Of most interest to the president, however, was the impact of the quality improvements on profitability. To help assess the dollar impact of the quality improvements, the actual sales and the actual quality costs for 20x4 and 20x5 are as follows by quality category: All prevention costs are fixed (by discretion). Assume all other quality costs are unit-level variable. Required: 1. Compute the relative distribution of quality costs for each year and prepare a pie chart. Do you believe that the company is moving in the right direction in terms of the balance among the quality cost categories? Explain. 2. Prepare a one-year trend performance report for 20x5 (compare the actual costs of 20x5 with those of 20x4, adjusted for differences in sales volume). How much have profits increased because of the quality improvements made by Major Company? 3. Estimate the additional improvement in profits if Major Company ultimately reduces its quality costs to 2.5 percent of sales revenues (assume sales of 10 million).arrow_forward
 Essentials of Business Analytics (MindTap Course ...StatisticsISBN:9781305627734Author:Jeffrey D. Camm, James J. Cochran, Michael J. Fry, Jeffrey W. Ohlmann, David R. AndersonPublisher:Cengage Learning
 Cornerstones of Cost Management (Cornerstones Ser...AccountingISBN:9781305970663Author:Don R. Hansen, Maryanne M. MowenPublisher:Cengage Learning
 Managerial AccountingAccountingISBN:9781337912020Author:Carl Warren, Ph.d. Cma William B. TaylerPublisher:South-Western College Pub
 Managerial Accounting: The Cornerstone of Busines...AccountingISBN:9781337115773Author:Maryanne M. Mowen, Don R. Hansen, Dan L. HeitgerPublisher:Cengage Learning
 Auditing: A Risk Based-Approach (MindTap Course L...AccountingISBN:9781337619455Author:Karla M Johnstone, Audrey A. Gramling, Larry E. RittenbergPublisher:Cengage Learning
 Financial And Managerial AccountingAccountingISBN:9781337902663Author:WARREN, Carl S.Publisher:Cengage Learning,