
Concept explainers
Videos
Suppose that Kicker had the following sales and cost experience (in thousands of dollars) for May of the current year and for May of the prior year:
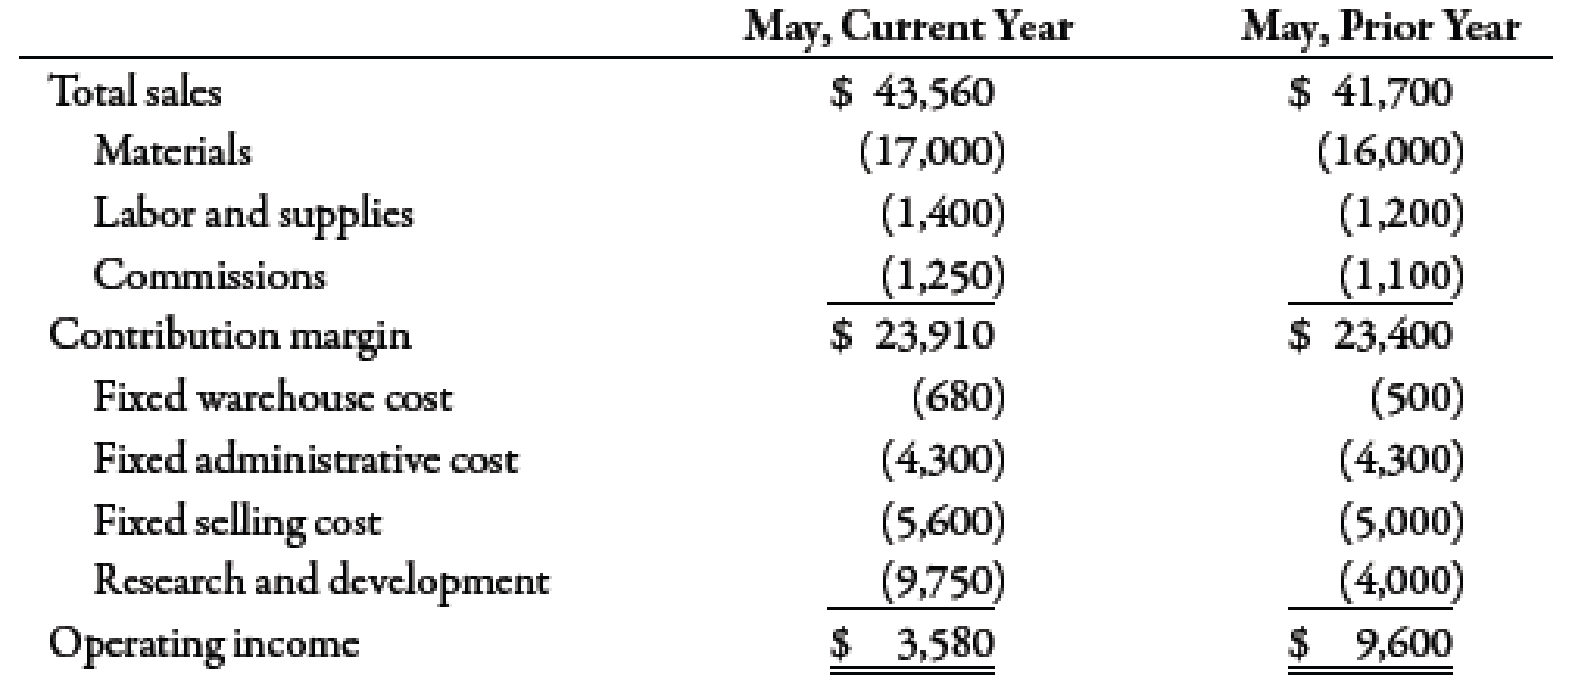
In May of the prior year, Kicker started an intensive quality program designed to enable it to build original equipment manufacture (OEM) speaker systems for a major automobile company. The program was housed in research and development. In the beginning of the current year, Kicker’s accounting department exercised tighter control over sales commissions, ensuring that no dubious (e.g., double) payments were made. The increased sales in the current year required additional warehouse space that Kicker rented in town. (Round ratios to four decimal places. Round sales dollars computations to the nearest dollar.)
Required:
- 1. Calculate the contribution margin ratio for May of both years.
- 2. Calculate the break-even point in sales dollars for both years.
- 3. Calculate the margin of safety in sales dollars for both years.
- 4. CONCEPTUAL CONNECTION Analyze the differences shown by your calculations in Requirements 1, 2, and 3.

Trending nowThis is a popular solution!

Chapter 7 Solutions
Managerial Accounting: The Cornerstone of Business Decision-Making


- At the beginning of the last quarter of 20x1, Youngston, Inc., a consumer products firm, hired Maria Carrillo to take over one of its divisions. The division manufactured small home appliances and was struggling to survive in a very competitive market. Maria immediately requested a projected income statement for 20x1. In response, the controller provided the following statement: After some investigation, Maria soon realized that the products being produced had a serious problem with quality. She once again requested a special study by the controllers office to supply a report on the level of quality costs. By the middle of November, Maria received the following report from the controller: Maria was surprised at the level of quality costs. They represented 30 percent of sales, which was certainly excessive. She knew that the division had to produce high-quality products to survive. The number of defective units produced needed to be reduced dramatically. Thus, Maria decided to pursue a quality-driven turnaround strategy. Revenue growth and cost reduction could both be achieved if quality could be improved. By growing revenues and decreasing costs, profitability could be increased. After meeting with the managers of production, marketing, purchasing, and human resources, Maria made the following decisions, effective immediately (end of November 20x1): a. More will be invested in employee training. Workers will be trained to detect quality problems and empowered to make improvements. Workers will be allowed a bonus of 10 percent of any cost savings produced by their suggested improvements. b. Two design engineers will be hired immediately, with expectations of hiring one or two more within a year. These engineers will be in charge of redesigning processes and products with the objective of improving quality. They will also be given the responsibility of working with selected suppliers to help improve the quality of their products and processes. Design engineers were considered a strategic necessity. c. Implement a new process: evaluation and selection of suppliers. This new process has the objective of selecting a group of suppliers that are willing and capable of providing nondefective components. d. Effective immediately, the division will begin inspecting purchased components. According to production, many of the quality problems are caused by defective components purchased from outside suppliers. Incoming inspection is viewed as a transitional activity. Once the division has developed a group of suppliers capable of delivering nondefective components, this activity will be eliminated. e. Within three years, the goal is to produce products with a defect rate less than 0.10 percent. By reducing the defect rate to this level, marketing is confident that market share will increase by at least 50 percent (as a consequence of increased customer satisfaction). Products with better quality will help establish an improved product image and reputation, allowing the division to capture new customers and increase market share. f. Accounting will be given the charge to install a quality information reporting system. Daily reports on operational quality data (e.g., percentage of defective units), weekly updates of trend graphs (posted throughout the division), and quarterly cost reports are the types of information required. g. To help direct the improvements in quality activities, kaizen costing is to be implemented. For example, for the year 20x1, a kaizen standard of 6 percent of the selling price per unit was set for rework costs, a 25 percent reduction from the current actual cost. To ensure that the quality improvements were directed and translated into concrete financial outcomes, Maria also began to implement a Balanced Scorecard for the division. By the end of 20x2, progress was being made. Sales had increased to 26,000,000, and the kaizen improvements were meeting or beating expectations. For example, rework costs had dropped to 1,500,000. At the end of 20x3, two years after the turnaround quality strategy was implemented, Maria received the following quality cost report: Maria also received an income statement for 20x3: Maria was pleased with the outcomes. Revenues had grown, and costs had been reduced by at least as much as she had projected for the two-year period. Growth next year should be even greater as she was beginning to observe a favorable effect from the higher-quality products. Also, further quality cost reductions should materialize as incoming inspections were showing much higher-quality purchased components. Required: 1. Identify the strategic objectives, classified by the Balanced Scorecard perspective. Next, suggest measures for each objective. 2. Using the results from Requirement 1, describe Marias strategy using a series of if-then statements. Next, prepare a strategy map. 3. Explain how you would evaluate the success of the quality-driven turnaround strategy. What additional information would you like to have for this evaluation? 4. Explain why Maria felt that the Balanced Scorecard would increase the likelihood that the turnaround strategy would actually produce good financial outcomes. 5. Advise Maria on how to encourage her employees to align their actions and behavior with the turnaround strategy.arrow_forwardIn 20x5, Major Company initiated a full-scale, quality improvement program. At the end of the year, Jack Aldredge, the president, noted with some satisfaction that the defects per unit of product had dropped significantly compared to the prior year. He was also pleased that relationships with suppliers had improved and defective materials had declined. The new quality training program was also well accepted by employees. Of most interest to the president, however, was the impact of the quality improvements on profitability. To help assess the dollar impact of the quality improvements, the actual sales and the actual quality costs for 20x4 and 20x5 are as follows by quality category: All prevention costs are fixed (by discretion). Assume all other quality costs are unit-level variable. Required: 1. Compute the relative distribution of quality costs for each year and prepare a pie chart. Do you believe that the company is moving in the right direction in terms of the balance among the quality cost categories? Explain. 2. Prepare a one-year trend performance report for 20x5 (compare the actual costs of 20x5 with those of 20x4, adjusted for differences in sales volume). How much have profits increased because of the quality improvements made by Major Company? 3. Estimate the additional improvement in profits if Major Company ultimately reduces its quality costs to 2.5 percent of sales revenues (assume sales of 10 million).arrow_forwardIn 20X1, Don Blackburn, president of Price Electronics, received a report indicating that quality costs were 31% of sales. Faced with increasing pressures from imported goods. Don resolved to take measures to improve the overall quality of the companys products. After hiring a consultant in 20X1, the company began an aggressive program of total quality control. At the end of 20X5, Don requested an analysis of the progress the company had made in reducing and controlling quality costs. The accounting department assembled the following data: Required: 1. Compute the quality costs as a percentage of sales by category and in total for each year. 2. Prepare a multiple-year trend graph for quality costs, both by total costs and by category. Using the graph, assess the progress made in reducing and controlling quality costs. Does the graph provide evidence that quality has improved? Explain. 3. Using the 20X1 quality cost relationships (assume all costs are variable), calculate the quality costs that would have prevailed in 20X4. By how much did profits increase in 20X4 because of the quality improvement program? Repeat for 20X5.arrow_forward
- Nabors Company had actual quality costs for the year ended June 30, 20x5, as given below. At the zero-defect state, Nabors expects to spend 375,000 on quality engineering, 75,000 on vendor certification, and 50,000 on packaging inspection. Assume sales to be 25,000,000. Required: 1. Prepare a long-range performance report for 20x5. What does this report tell the management of Nabors? 2. Explain why quality costs still are present for the zero-defect state. 3. What if Nabors achieves the zero-defect state reflected in the report? What are some of the implications of this achievement?arrow_forwardRecently, Ulrich Company received a report from an external consulting group on its quality costs. The consultants reported that the companys quality costs total about 21 percent of its sales revenues. Somewhat shocked by the magnitude of the costs, Rob Rustin, president of Ulrich Company, decided to launch a major quality improvement program. For the coming year, management decided to reduce quality costs to 17 percent of sales revenues. Although the amount of reduction was ambitious, most company officials believed that the goal could be realized. To improve the monitoring of the quality improvement program, Rob directed Pamela Golding, the controller, to prepare monthly performance reports comparing budgeted and actual quality costs. Budgeted costs and sales for the first two months of the year are as follows: The following actual sales and actual quality costs were reported for January: Required: 1. Reorganize the monthly budgets so that quality costs are grouped in one of four categories: appraisal, prevention, internal failure, or external failure. (Essentially, prepare a budgeted cost of quality report.) Also, identify each cost as variable (V) or fixed (F). (Assume that no costs are mixed.) 2. Prepare a performance report for January that compares actual costs with budgeted costs. Comment on the companys progress in improving quality and reducing its quality costs.arrow_forwardIn 2011, Milton Thayne, president of Carbondale Electronics, received a report indicating that quality costs were 31 percent of sales. Faced with increasing pressures from imported goods, Milton resolved to take measures to improve the overall quality of the companys products. After hiring a consultant in 20x0, the company began an aggressive program of total quality control. At the end of 20x5, Milton requested an analysis of the progress the company had made in reducing and controlling quality costs. The Accounting Department assembled the following data: Required: 1. Compute the quality costs as a percentage of sales by category and in total for each year. 2. Prepare a multiple-year trend graph for quality costs, both by total costs and by category. Using the graph, assess the progress made in reducing and controlling quality costs. Does the graph provide evidence that quality has improved? Explain. 3. Using the 20x1 quality cost relationships (assume all costs are variable), calculate the quality costs that would have prevailed in 20x4. By how much did profits increase in 20x4 because of the quality improvement program? Repeat for 20x5.arrow_forward
- The demand for solvent, one of numerous products manufactured by Logan Industries Inc., has dropped sharply because of recent competition from a similar product. The companys chemists are currently completing tests of various new formulas, and it is anticipated that the manufacture of a superior product can be started on November 1, one month in the future. No changes will be needed in the present production facilities to manufacture the new product because only the mixture of the various materials will be changed. The controller has been asked by the president of the company for advice on whether to continue production during October or to suspend the manufacture of solvent until November 1. The following data have been assembled: The production costs and selling and administrative expenses, based on production of 10,000 units in September, are as follows: Sales for October are expected to drop about 40% below those of September. No significant changes are anticipated in the fixed costs or variable costs per unit. No extra costs will be incurred in discontinuing operations in the portion of the plant associated with solvent. The inventory of solvent at the beginning and end of October is not expected to be significant (material). Instructions 1. Prepare an estimated income statement in absorption costing form for October for solvent, assuming that production continues during the month. 2. Prepare an estimated income statement in variable costing form for October for solvent, assuming that production continues during the month. 3. What would be the estimated operating loss if the solvent production were temporarily suspended for October? 4. What advice should you give to management?arrow_forwardPosavek is a wholesale supplier of building supplies building contractors, hardware stores, and home-improvement centers in the Boston metropolitan area. Over the years, Posavek has expanded its operations to serve customers across the nation and now employs over 200 people as technical representatives, buyers, warehouse workers, and sales and office staff. Most recently, Posavek has experienced fierce competition from the large online discount stores. In addition, the company is suffering from operational inefficiencies related to its archaic information system. Posavek revenue cycle procedures are described in the following paragraphs. Revenue Cycle Posaveks sales department representatives receive orders via traditional mail, e-mail, telephone, and the occasional walk-in customer. Because Posavek is a wholesaler, the vast majority of its business is conducted on a credit basis. The process begins in the sales department, where the sales clerk enters the customers order into the centralized computer sales order system. The computer and file server are housed in Posaveks small data processing department. If the customer has done business with Posavek in the past, his or her data are already on file. If the customer is a first-time buyer, however, the clerk creates a new record in the customer account file. The system then creates a record of the transaction in the open sales order file. When the order is entered, an electronic copy of it is sent to the customers e-mail address as confirmation. A clerk in the warehouse department periodically reviews the open sales order file from a terminal and prints two copies of a stock release document for each new sale, which he uses to pick the items sold from the shelves. The warehouse clerk sends one copy of the stock release to the sales department and the second copy, along with the goods, to the shipping department. The warehouse clerk then updates the inventory subsidiary file to reflect the items and quantities shipped. Upon receipt of the stock release document, the sales clerk accesses the open sales order file from a terminal, closes the sales order, and files the stock release document in the sales department. The sales order system automatically posts these transactions to the sales, inventory control, and cost-of-goods-sold accounts in the general ledger file. Upon receipt of the goods and the stock release, the shipping department clerk prepares the goods for shipment to the customer. The clerk prepares three copies of the bill of lading. Two of these go with the goods to the carrier and the third, along with the stock release document, is filed in the shipping department. The billing department clerk reviews the closed sales orders from a terminal and prepares two copies of the sales invoice. One copy is mailed to the customer, and the other is filed in the billing department. The clerk then creates a new record in the accounts receivable subsidiary file. The sales order system automatically updates the accounts receivable control account in the general ledger file. CASH RECEIPTS PROCEDURES Mail room clerks open customer cash receipts, reviews the check and remittance advices for completeness, and prepares two copies of a remittance list. One copy is sent with the checks to the cash receipts department. The second copy of the remittance advices are sent to the billing department. When the cash receipts clerk receives the checks and remittance list, he verifies the checks received against those on the remittance list and signs the checks For Deposit Only. Once the checks are endorsed, he records the receipts in the cash receipts journal from his terminal. The clerk then fills out a deposit slip and deposits the checks in the bank. Upon receipt of the remittances, the billing department clerk records the amounts in the accounts receivable subsidiary ledger from the department terminal. The system automatically updates the AR control account in the general ledger Posavek has hired your public accounting firm to review its sales order procedures for internal control compliance and to make recommendations for changes. Required a. Create a data flow diagram of the current system. b. Create a system flowchart of the existing system. c. Analyze the physical internal control weaknesses in the system. d. (Optional) Prepare a system flowchart of a redesigned computer-based system that resolves the control weaknesses that you identified. Explain your solution.arrow_forwardMalone Industries has been in business for five years and has been very successful. In the past year, it expanded operations by buying Hot Metal Manufacturing for a price greater than the value of the net assets purchased. In the past year, the customer base has expanded much more than expected, and the companys owners want to increase the goodwill account. Your CPA firm has been hired to help Malone prepare year-end financial statements, and your boss has asked you to talk to Malones managers about goodwill and whether an adjustment can be made to the goodwill account. How do you respond to the owners and managers?arrow_forward
- Javier Company has sales of 8 million and quality costs of 1,600,000. The company is embarking on a major quality improvement program. During the next three years, Javier intends to attack failure costs by increasing its appraisal and prevention costs. The right prevention activities will be selected, and appraisal costs will be reduced according to the results achieved. For the coming year, management is considering six specific activities: quality training, process control, product inspection, supplier evaluation, prototype testing, and redesign of two major products. To encourage managers to focus on reducing non-value-added quality costs and select the right activities, a bonus pool is established relating to reduction of quality costs. The bonus pool is equal to 10 percent of the total reduction in quality costs. Current quality costs and the costs of these six activities are given in the following table. Each activity is added sequentially so that its effect on the cost categories can be assessed. For example, after quality training is added, the control costs increase to 320,000, and the failure costs drop to 1,040,000. Even though the activities are presented sequentially, they are totally independent of each other. Thus, only beneficial activities need be selected. Required: 1. Identify the control activities that should be implemented, and calculate the total quality costs associated with this selection. Assume that an activity is selected only if it increases the bonus pool. 2. Given the activities selected in Requirement 1, calculate the following: a. The reduction in total quality costs b. The percentage distribution for control and failure costs c. The amount for this years bonus pool 3. Suppose that a quality engineer complained about the gainsharing incentive system. Basically, he argued that the bonus should be based only on reductions of failure and appraisal costs. In this way, investment in prevention activities would be encouraged, and eventually, failure and appraisal costs would be eliminated. After eliminating the non-value-added costs, focus could then be placed on the level of prevention costs. If this approach were adopted, what activities would be selected? Do you agree or disagree with this approach? Explain.arrow_forwardRichmond, Inc., operates a chain of 44 department stores. Two years ago, the board of directors of Richmond approved a large-scale remodeling of its stores to attract a more upscale clientele. Before finalizing these plans, two stores were remodeled as a test. Linda Perlman, assistant controller, was asked to oversee the financial reporting for these test stores, and she and other management personnel were offered bonuses based on the sales growth and profitability of these stores. While completing the financial reports, Perlman discovered a sizable inventory of outdated goods that should have been discounted for sale or returned to the manufacturer. She discussed the Situation with her management colleagues; the consensus was to ignore reporting this inventory as obsolete because reporting it would diminish the financial results and their bonuses. Required: According to the IMA’s Statement of Ethical Professional Practice, would it be ethical for Perlman not to report the inventory…arrow_forwardThe demand for solvent, one of numerous products manufactured by Logan Industries Inc., has dropped sharply because of recent competition from a similar product. The company’s chemists are currently completing tests of various new formulas, and it is anticipated that the manufacture of a superior product can be started on November 1, one month in the future. No changes will be needed in the present production facilities to manufacture the new product because only the mixture of the various materials will be changed. The controller has been asked by the president of the company for advice on whether to continue production during October or to suspend the manufacture of solvent until November 1. The following data have been assembled: Logan Industries Inc. Income Statement—Solvent For the Month Ended September 30 1 Sales (10,000 units) $800,000.00 2 Cost of goods sold (770,000.00) 3 Gross profit $30,000.00 4 Selling and…arrow_forward
 Managerial Accounting: The Cornerstone of Busines...AccountingISBN:9781337115773Author:Maryanne M. Mowen, Don R. Hansen, Dan L. HeitgerPublisher:Cengage Learning
 Cornerstones of Cost Management (Cornerstones Ser...AccountingISBN:9781305970663Author:Don R. Hansen, Maryanne M. MowenPublisher:Cengage Learning
 Managerial AccountingAccountingISBN:9781337912020Author:Carl Warren, Ph.d. Cma William B. TaylerPublisher:South-Western College Pub
 Auditing: A Risk Based-Approach (MindTap Course L...AccountingISBN:9781337619455Author:Karla M Johnstone, Audrey A. Gramling, Larry E. RittenbergPublisher:Cengage Learning
 Principles of Accounting Volume 1AccountingISBN:9781947172685Author:OpenStaxPublisher:OpenStax College
 Principles of Cost AccountingAccountingISBN:9781305087408Author:Edward J. Vanderbeck, Maria R. MitchellPublisher:Cengage Learning