
An Introduction to Statistical Methods and Data Analysis
7th Edition
ISBN: 9781305269477
Author: R. Lyman Ott, Micheal T. Longnecker
Publisher: Cengage Learning
expand_more
expand_more
format_list_bulleted
Concept explainers
Videos
Textbook Question
Chapter 10.11, Problem 7E
The test for screening donated blood for the presence of the AIDS virus was developed of the test, 1,000 persons known to have AIDS and 10,000 persons known to not have AIDS were given the test. The following results were tabulated:
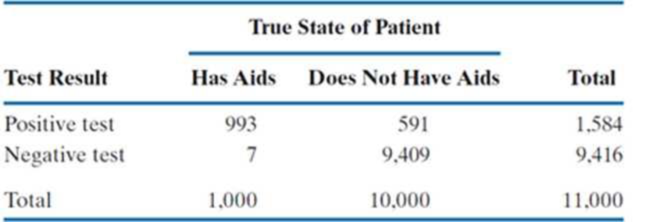
- a. Place a 99% confidence interval on the proportion of false positives produced by the test.
- b. Is there substantial evidence (α = .01) that the test produces less than 5% false positives.
in the 1980s. It is designed to detect antibodies, substances produced in the body of donors carrying the virus; however, it is not 100% accurate. The developer of the test claimed that the test would produce fewer than 5% false positives and fewer than 1% false negatives. In order to evaluate the accuracy
Expert Solution & Answer
Want to see the full answer?
Check out a sample textbook solution
Students have asked these similar questions
An apple farmer inspects a large random sample of his apples and finds that 20% contain excellent worms. He wants to charge his customers extra, and claims that the 90% confidence interval for the population pro- portion of apples that contain worms has a margin of error of at most 0.01. At least how many apples did the farmer inspect?
The drug Viagra became available in the U.S. in May 1988, in the wake of an advertising campaign that was unprecedented in scope and intensity. A Gallup poll found that by the end of the first week of May, 643 out of 1,005 adults were aware that Viagra was an impotency medication.
a) Is the sample size large enough to compute a confidence interval for the proportion of adults who were aware that Viagra was an impotency medication after the first week of May?
Yes, because more than 10 adults were not aware of Viagra
Yes, because the sample size is greater than 30
Yes, because more than 10 adults were aware of Viagra
Yes, because both np̂ and n(1-p̂) are greater than 10
b)Using the information from questions 1-3, suppose that p̂ is 0.40 and the standard error of p̂ is 0.10. Compute a 90% confidence interval for the proportion of adults that were aware of Viagra.
(0.2355, 0.5645)
(0.3, 0.5)
(0.2355, 0.4)
(0.3, 0.4)
A random sample of residents in city J were surveyed about whether they supported raising taxes to increase bus service for the city. From the results, a 95 percent confidence interval was constructed to estimate the proportion of people in the city who support the increase. The interval was (0.46,0.52)(0.46,0.52).
Based on the confidence interval, which of the following claims is supported?
A) More than 90 percent of the residents support the increase.
B) More than 60 percent of the residents support the increase.
C) More than 40 percent of the residents support the increase.
D) Fewer than 10 percent of the residents support the increase.
E) Fewer than 25 percent of the residents support the increase.
Chapter 10 Solutions
An Introduction to Statistical Methods and Data Analysis
Ch. 10.11 - Prob. 1ECh. 10.11 - For each of the following values for and n,...Ch. 10.11 - Prob. 3ECh. 10.11 - A random sample of 1,200 units is randomly...Ch. 10.11 - A public opinion polling agency plans to conduct a...Ch. 10.11 - The test for screening donated blood for the...Ch. 10.11 - National public opinion polls are often based on...Ch. 10.11 - Prob. 17ECh. 10.11 - A large retail lawn care dealer currently provides...Ch. 10.11 - Prob. 20E
Ch. 10.11 - Sludge is a dried product remaining from processed...Ch. 10.11 - A political scientist is studying the impact of a...Ch. 10.11 - The quality control department of a motorcycle...Ch. 10.11 - Refer to Exercise 10.29. a. Place 95% confidence...Ch. 10.11 - The article “Positive Aspects of Caregiving”...Ch. 10.11 - A study examining bomb hits in South London during...Ch. 10.11 - The fire department in a large city is examining...Ch. 10.11 - Prob. 53ECh. 10.11 - A carcinogenicity study was conducted to examine...
Knowledge Booster


Learn more about
Need a deep-dive on the concept behind this application? Look no further. Learn more about this topic, statistics and related others by exploring similar questions and additional content below.Similar questions
- A recent study on the way that people talk indicated, with 95 percent confidence, that between 35 percent and 41percent of all adults find the word “whatever” to be the most annoying word in conversation.Based on the confidence interval, which of the following claims is supported?(A) Less than 25 percent of all adults find the word “whatever” to be the most annoying word in conversation.(B) More than 30 percent of all adults find the word “whatever” to be the most annoying word in conversation.(C) More than 45 percent of all adults find the word “whatever” to be the most annoying word in conversation.(D) More than half of all adults find the word “whatever” to be the most annoying word in conversation.(E) At least 95 percent of all adults find the word “whatever” to be the most annoying word in conversation.arrow_forwardA department store finds that in a random sample of 200 customers, 60% of the sampled customers had browsed its website prior to visiting the store. Based on this data, a 90% confidence interval for the population proportion of customers that browse the store’s website prior to visiting the store will be between _________________. 0.6588 and 0.6312 0.4528 and 0.5250 0.5960 and 6040 0.5978 and 0.6022 0.5430 and 0.6570arrow_forwardCan any of the following values be rejected at the 95% confidence interval using the Grubbs test? 0.8452 0.8265 0.8401 0.8422 0.8397 Average = 0.83874 St. Dev. = 0.007181 1)Yes, 0.8265 should be eliminated because Gcalc is 1.71 and Gcalc > Gtable. 2)No, data can never be eliminated using the Grubbs test. 3)Yes, 0.8265 should be eliminated because Gcalc is 1.71 and Gcalc < Gtable. 4)Yes, 0.8452 should be eliminated because Gcalc is 0.90 and Gcalc < Gtable. 5)No, 0.8265 should not be eliminated because Gcalc is 1.71 and Gcalc < Gtable. 6) Yes, 0.8265 should be eliminated because is it 0.0132 away from the next nearest value.arrow_forward
- In a particular year, approximately 136,943,000 people visited an emergency room in the United States. In a random sample of 100,000 visits, 12,462 were subsequently admitted to the hospital. Provide a 99% confidence interval for the proportion of people visiting an emergency room who were subsequently admitted to the hospital. a) 0.121745 to 0.127495 b) 0.121930 to 0.127310 c) 0.122573 to 0.126667 d) 0.122902 to 0.126338arrow_forwardDuring a flu vaccine shortage in the United States, less than a majority ofpeople were able to receive the vaccine. The results of a survey given to a random sample of 2,350 vaccine-eligible people indicated that 978 of the 2,350 people had received flu vaccine. b.Suppose a similar survey will be given to vaccine-eligible people in Canada by Canadian health officials. A 95 percent confidence interval for the proportion of people who will have received fluvaccine is to be constructed. Using 0.5 as your estimated proportion, what is the smallest sample size that can be used to guarantee that the margin oferror will be less than or equal to 0.02?arrow_forwardIn an article in the Journal of Advertising, Weinberger and Spotts compare the use of humor in television ads in the United States and the United Kingdom. They found that a substantially greater percentage of U.K. ads use humor.a. Suppose that a random sample of 400 television ads in the United Kingdom reveals that 142 of these ads use humor. Find a point estimate of and a 95 percent confidence interval for the proportion of all U.K. television ads that use humor.b. Suppose a random sample of 500 television ads in the United States reveals that 122 of these ads use humor. Find a point estimate of and a 95 percent confidence interval for the proportion of all U.S. television ads that use humor.c. Do the confidence intervals you computed in parts a and b suggest that a greater percentage of U.K. ads use humor? Explain.arrow_forward
- A national opinion poll found that 44% of all American adults agree that parents should be given vouchers that are good for education at any public or private school of their choice. The result was based on a small sample. How large of a sample is required to obtain a margin of error of 0.03 in a 99% confidence interval? a. Use the national opinion poll from a previous study to find the sample size: b. Use the conservative guess of p = 0.5 to calculate the sample size:arrow_forwardA random sample of students at a college shows that 54 of 200 students had part-time jobs. Which of the follow-ing is the correct formula for a 90% confidence interval for the proportion of all students at this college withpart-time jobs?A) 0.27 { 1.28B10.27210.732200B) 0.27 { 1.28B10.5210.52200C) 0.27 { 1.645B10.27210.732200D) 0.27 { 1.645B10.5210.52200E) 0.27 { 1.96B10.27210.732200arrow_forwardAn investigator has calculated a 95 percent confidence interval for a one-sample t test and found: P{97.0≤μ≤105.0}=0.95. If the investigator wants to test the hull hypothesis H0: μ=100,with α=0.05, the investigator should:arrow_forward
- 1. A recent survey showed that from a sample of 500 packages delivered by a Postal Service, 480were delivered on time. a) Construct a 95% confidence interval for the proportion of all packages that are deliveredon time by the Postal Service.arrow_forwardA recent survey of cell phone users indicated that 56 percent of the respondents prefer to use cell phones for texting rather than for making phone calls. A 95 percent confidence interval for the estimate of all cell phone users who prefer to use cell phones for texting has a margin of error of 3 percent. Assume all conditions for inference have been met. Based on the confidence interval, which of the following claims is supported? Select A, B, C, or D Less than half of all people prefer texting. A More than half of all people prefer texting. B At least 60 percent of all people prefer texting. C At least 75 percent of all people prefer texting. D At least 95 percent of all people prefer texting. Earrow_forwardOn the Navajo Reservation, a random sample of 228 permanent dwellings in the Fort Defiance region showed that 54were traditional Navajo hogans. In the Indian Wells region, a random sample of 143 permanent dwellings showed that 18 were traditional hogans. Let p1 be the population proportion of all traditional hogans in the Fort Defiance region, and let p2 be the population proportion of all traditional hogans in the Indian Wells region. (a) Find a 90% confidence interval for p1 − p2. (Round your answer to three decimal places.) lower limit upper limit (b) Examine the confidence interval and comment on its meaning. Does it include numbers that are all positive? all negative? mixed? What if it is hypothesized that Navajo who follow the traditional culture of their people tend to occupy hogans? Comment on the confidence interval for p1 − p2 in this context. Because the interval contains only positive numbers, we can say that there is a higher proportion of hogans in the…arrow_forward
arrow_back_ios
SEE MORE QUESTIONS
arrow_forward_ios
Recommended textbooks for you
 MATLAB: An Introduction with ApplicationsStatisticsISBN:9781119256830Author:Amos GilatPublisher:John Wiley & Sons Inc
 Probability and Statistics for Engineering and th...StatisticsISBN:9781305251809Author:Jay L. DevorePublisher:Cengage Learning
 Statistics for The Behavioral Sciences (MindTap C...StatisticsISBN:9781305504912Author:Frederick J Gravetter, Larry B. WallnauPublisher:Cengage Learning
 Elementary Statistics: Picturing the World (7th E...StatisticsISBN:9780134683416Author:Ron Larson, Betsy FarberPublisher:PEARSON
 The Basic Practice of StatisticsStatisticsISBN:9781319042578Author:David S. Moore, William I. Notz, Michael A. FlignerPublisher:W. H. Freeman
 Introduction to the Practice of StatisticsStatisticsISBN:9781319013387Author:David S. Moore, George P. McCabe, Bruce A. CraigPublisher:W. H. Freeman
MATLAB: An Introduction with Applications
Statistics
ISBN:9781119256830
Author:Amos Gilat
Publisher:John Wiley & Sons Inc
Probability and Statistics for Engineering and th...
Statistics
ISBN:9781305251809
Author:Jay L. Devore
Publisher:Cengage Learning
Statistics for The Behavioral Sciences (MindTap C...
Statistics
ISBN:9781305504912
Author:Frederick J Gravetter, Larry B. Wallnau
Publisher:Cengage Learning
Elementary Statistics: Picturing the World (7th E...
Statistics
ISBN:9780134683416
Author:Ron Larson, Betsy Farber
Publisher:PEARSON
The Basic Practice of Statistics
Statistics
ISBN:9781319042578
Author:David S. Moore, William I. Notz, Michael A. Fligner
Publisher:W. H. Freeman
Introduction to the Practice of Statistics
Statistics
ISBN:9781319013387
Author:David S. Moore, George P. McCabe, Bruce A. Craig
Publisher:W. H. Freeman
Statistics 4.1 Point Estimators; Author: Dr. Jack L. Jackson II;https://www.youtube.com/watch?v=2MrI0J8XCEE;License: Standard YouTube License, CC-BY
Statistics 101: Point Estimators; Author: Brandon Foltz;https://www.youtube.com/watch?v=4v41z3HwLaM;License: Standard YouTube License, CC-BY
Central limit theorem; Author: 365 Data Science;https://www.youtube.com/watch?v=b5xQmk9veZ4;License: Standard YouTube License, CC-BY
Point Estimate Definition & Example; Author: Prof. Essa;https://www.youtube.com/watch?v=OTVwtvQmSn0;License: Standard Youtube License
Point Estimation; Author: Vamsidhar Ambatipudi;https://www.youtube.com/watch?v=flqhlM2bZWc;License: Standard Youtube License