
Concept explainers
Videos
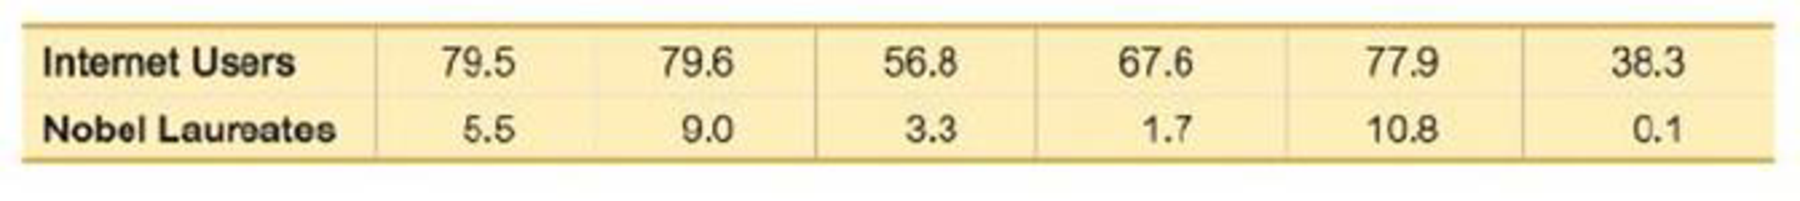
Regression and Predictions. Exercises 13–28 use the same data sets as Exercises 13–28 in Section 10-1. In each case, find the regression equation, letting the first variable be the predictor (x) variable, hind the indicated predicted value by following the prediction procedure summarized in Figure 10-5 on page 493.
13. Internet and Nobel Laureates Find the best predicted Nobel Laureate rate for Japan, which has 79.1 Internet users per 100 people. How does it compare to Japan’s Nobel Laureate rate of 1.5 per 10 million people?

Learn your wayIncludes step-by-step video

Chapter 10 Solutions
MYLAB ELEMENTARY STATISTICS
Additional Math Textbook Solutions
Elementary Statistics: Picturing the World (6th Edition)
An Introduction to Mathematical Statistics and Its Applications (6th Edition)
Statistical Reasoning for Everyday Life (5th Edition)
Intro Stats
Intro Stats, Books a la Carte Edition (5th Edition)


- (a) For United States, provide data for the variables below over the years 1993 –2007:(i) Net migration rate (per 1,000 population)(ii) Total fertility rate (live births per woman)(iii)Unemployment, general level (Thousands)(iv) Wages(v) Life expectancy at birth for both sexes combined (years)Data can be obtained from the UN database http://data.un.org/Explorer.aspxUsing R-Studio, estimate a regression equation to determine the effect of unemployment,general level, wages and life expectancy at birth for both sexes on the net migration rate.(All codes and regression output should be provided).(i) Write down the regression equation. (ii) Interpret the coefficients and determine which of the individual coefficients in theregression model are statistically significant. In responding, construct and test anyappropriate hypothesis. (iii) Interpret the coefficient of determination.arrow_forwardThe November 24, 2001, issue of The Economist published economic data for 15 industrialized nations. Included were the percent changes in gross domestic product (GDP), industrial production (IP), consumer prices (CP), and producer prices (PP) from Fall 2000 to Fall 2001, and the unemployment rate in Fall 2001 (UNEMP). An economist wants to construct a model to predict GDP from the other variables. A fit of the model GDP = , + P,IP + 0,UNEMP + f,CP + P,PP + € yields the following output: The regression equation is GDP = 1.19 + 0.17 IP + 0.18 UNEMP + 0.18 CP – 0.18 PP Predictor Coef SE Coef тР Constant 1.18957 0.42180 2.82 0.018 IP 0.17326 0.041962 4.13 0.002 UNEMP 0.17918 0.045895 3.90 0.003 CP 0.17591 0.11365 1.55 0.153 PP -0.18393 0.068808 -2.67 0.023 Predict the percent change in GDP for a country with IP = 0.5, UNEMP = 5.7, CP = 3.0, and PP = 4.1. a. b. If two countries differ in unemployment rate by 1%, by how much would you predict their percent changes in GDP to differ, other…arrow_forward(a) For United States, provide data for the variables below over the years 1993 – 2007: (i) Net migration rate (per 1,000 population) (ii) Total fertility rate (live births per woman) (iii)Unemployment, general level (Thousands) (iv) Wages (v) Life expectancy at birth for both sexes combined (years) Data can be obtained from the UN database http://data.un.org/Explorer.aspx Using R-Studio, estimate a regression equation to determine the effect of unemployment, general level, wages and life expectancy at birth for both sexes on the net migration rate. (All codes and regression output should be provided). (iv) Using the 10% level of significance, determine and discuss whether the overall regression equation is statistically significant. In responding, construct and test any appropriate hypothesis. (v) Determine and interpret the confidence interval for the independent variable(s).arrow_forward
- (a) For United States, provide data for the variables below over the years 1993 – 2007: (i) Net migration rate (per 1,000 population) (ii) Total fertility rate (live births per woman) (iii)Unemployment, general level (Thousands) (iv) Wages (v) Life expectancy at birth for both sexes combined (years) Data can be obtained from the UN database http://data.un.org/Explorer.aspx Using R-Studio, estimate a regression equation to determine the effect of unemployment, general level, wages and life expectancy at birth for both sexes on the net migration rate. (All codes and regression output should be provided).(b) Using R-Studio redo the regression analysis with the total fertility rate as an additionalindependent variable. (All codes and regression output should be provided).(i) Write down the regression equation. (ii) Use the 5% level of significance, determine and discuss whether the total fertilityrate has a significant impact on the net migration rate in your assigned country.…arrow_forwardDiscuss the importance of a model being well documented.arrow_forwardonly part 1, 3, 4 please In the article “Explaining an Unusual Allergy,” appearing on the Everyday Health Network, Dr. A. Feldweg explained that allergy to sulfites is usually seen in patients with asthma. The typical reaction is a sudden increase in asthma symptoms after eating a food containing sulfites. Studies are performed to estimate the percentage of the nation’s 10 million asthmatics who are allergic to sulfites. In one survey, 38 of 500 randomly selected U.S. asthmatics were found to be allergic to sulfites. 95% confidence. Determine the margin of error for the estimate of p. Obtain a sample size that will ensure a margin of error of at most 0.01 for a 95% confidence interval without making a guess for the observed value of ?̂ . Find a 95% confidence interval for p if, for a sample of the size determined in part (b), the proportion of asthmatics sampled who are allergic to sulfites in 0.071. Determine the margin of error for the estimate in part (c) and compare it to…arrow_forward
- Section 10.2 Question #9 The data show the bug chirps per minute at different temperatures. Find the regression equation, letting the first variable be the independent (x) variable. Find the best predicted temperature for a time when a bug is chirping at the rate of 3000 chirps per minute. Use a significance level of 0.05. What is wrong with this predicted value? Chirps in 1 min 981 1023 1074 1101 1203 874 Temperature (°F) 83 79.4 80.9 82.8 92.3 72.8 What is the regression equation? y= ___________+ ___________x (Round the x-coefficient to four decimal places as needed. Round the constant to two decimal places as needed.) What is the best predicted temperature for a time when a bug is chirping at the rate of 3000 chirps per minute? The best predicted temperature when a bug is chirping at 3000 chirps per minute is _________°F. (Round to one decimal place as needed.)arrow_forwardWrite a detail note on REGRESSION?arrow_forwardBirthrates 2009 The table shows the number of livebirths per 1000 women aged 15–44 years in the United States, starting in 1965. (National Center for Health Sta-tistics, www.cdc.gov/nchs/) a) Make a scatterplot and describe the general trend in Birth-rates. (Enter Year as years since 1900: 65, 70, 75, etc.) b) Find the equation of the regression line.c) Check to see if the line is an appropriate model. Explain.d) Interpret the slope of the line.e) The table gives rates only at 5-year intervals. Estimatewhat the rate was in 1978.f) In 1978, the birthrate was actually 15.0. How close didyour model come?g) Predict what the Birthrate will be in 2010. Commenton your faith in this prediction.h) Predict the Birthrate for 2025. Comment on your faithin this prediction.arrow_forward
- 13) Use computer software to find the multiple regression equation. Can the equation be used for prediction? An anti-smoking group used data in the table to relate the carbon monoxide( CO) of various brands of cigarettes to their tar and nicotine (NIC) content. 13). CO TAR NIC 15 1.2 16 15 1.2 16 17 1.0 16 6. 0.8 1 0.1 1 8. 0.8 8. 10 0.8 10 17 1.0 16 15 1.2 15 11 0.7 9. 18 1.4 18 16 1.0 15 10 0.8 9. 0.5 18 1.1 16 A) CO = 1.37 + 5.50TAR – 1.38NIC; Yes, because the P-value is high. B) CÓ = 1.37 - 5.53TAR + 1.33NIC; Yes, because the R2 is high. C) CO = 1.25 + 1.55TAR – 5.79NIC; Yes, because the P-value is too low. D) CO = 1.3 + 5.5TAR - 1.3NIC; Yes, because the adjusted R2 is high. %3Darrow_forwardWhich of the figures shows a violation of regression model assumption? 1 2 3 4arrow_forwardWhat is the relationship between the amount of time statistics students study per week and their final exam scores? The results of the survey are shown below. Time Score 3 4 73 16 2 15 10 3 95 61 67 67 88 90 75 a. Find the correlation coefficient: r = b. The null and alternative hypotheses for correlation are: Hg: ?v = 0 H: ?v + 0 Round to 2 decimal places. The p-value is: (Round to four decimal places) c. Use a level of significance of a = 0.05 to state the conclusion of the hypothesis test in the context of the study. O There is statistically insignificant evidence to conclude that a student who spends more time studying will score higher on the final exam than a student who spends less time studying. O There is statistically significant evidence to conclude that there is a correlation between the time spent studying and the score on the final exam. Thus, the regression line is useful. O There is statistically insignificant evidence to conclude that there is a correlation between the…arrow_forward
 Algebra & Trigonometry with Analytic GeometryAlgebraISBN:9781133382119Author:SwokowskiPublisher:Cengage
 Big Ideas Math A Bridge To Success Algebra 1: Stu...AlgebraISBN:9781680331141Author:HOUGHTON MIFFLIN HARCOURTPublisher:Houghton Mifflin Harcourt