
Student's Solutions Manual For Statistics For Business And Economics
13th Edition
ISBN: 9780134513034
Author: Boudreau, Nancy
Publisher: PEARSON
expand_more
expand_more
format_list_bulleted
Concept explainers
Videos
Textbook Question
Chapter 10.3, Problem 10.31ACI
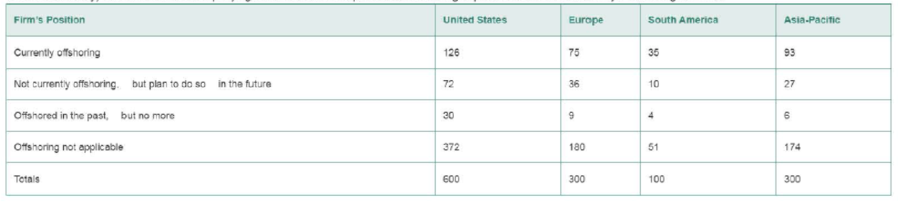
Offshoring companies. Refer to The Journal of Applied Business Research (January/February 2011) study of offshoring companies, Exercise 10.10 (p. 583). In addition to U.S. firms, CEOs from international companies were also surveyed on their offshoring positions. The number of firms in each position category (adapted from the results of the actual study) is shown in the accompanying table Does a firm’s position on offshoring depend on the firm’s nationality? Test using α = 05.
Expert Solution & Answer
Want to see the full answer?
Check out a sample textbook solution
Students have asked these similar questions
A statistical program is recommended.
Jensen Tire & Auto is in the process of deciding whether to purchase a maintenance contract for its new computer wheel alignment and balancing machine. Managers feel that maintenance expense should be related to usage, and they collected the following information on weekly usage (hours) and annual maintenance expense (in hundreds of dollars).
Weekly Usage(hours)
AnnualMaintenanceExpense
13
17.0
10
22.0
20
30.0
28
37.0
32
47.0
17
30.5
24
32.5
31
39.0
40
51.5
38
40.0
#1) Develop the estimated regression equation that could be used to predict the annual maintenance expense (in hundreds of dollars) given the weekly usage (in hours). (Round your numerical values to two decimal places.)
#2) The expected expense of a machine being used 34 hours per week is $ hundred.
The following data are obtained from a study that seeks to investigate theeffects of an intervention program and the extent of their physical disability on their reading, math and IQ scores. The students who had been recipients of an intervention program are in the treatment group and while those who are not are in the control group.
Questions:1. Is there a significant difference in the math, reading and IQ scores ofstudents in the treatment and controlgroups?2. Is the intervention program effective?3. Is there a significant difference in the math, reading and IQ scores ofstudentswhen they are grouped according to the extent of their physicaldisability?4. Isthereasignificantinteractionbetweentreatmentandextentofdisabilityonthe students’ reading, math and IQscores?
A cross-sectional study is conducted to investigate cardiovascular disease (CVD) risk factors among a sample of patients seeking medical care at one of three local hospitals. A total of 500500 patients are enrolled. Based on the following data, we would like to determine if there is a significant association between the family history of CVD and the enrollment site.
Enrollment Site
Family History of CVD
Hospital 1
Hospital 2
Hospital 3
Total
Yes
34
8
58
100
No
104
72
224
400
Total
138
80
282
500
Given:
The value of the test statistic is χ2= 6.912
Use α=0.1 as the level of significance.
The superintendent of Hospital 2 performed the Goodness of Fit Test to test whether 25% of the patients go to Hospital 1, 15% of the patients go to Hospital 2 and 60% of the patients go to Hospital 3.
Given: The superintendent found that the pp-value for the test is 0.25091
Let:
p1=p1= be the proportion of patients at Hospital 1
p2=p2= be the proportion of patients at…
Chapter 10 Solutions
Student's Solutions Manual For Statistics For Business And Economics
Ch. 10.2 - Find the rejection region for a one-dimensional 2...Ch. 10.2 - What are the characteristics of a multinomial...Ch. 10.2 - What conditions must n satisfy to make the 2 test...Ch. 10.2 - A multinomial experiment with k = 3 cells and n =...Ch. 10.2 - Prob. 10.5LMCh. 10.2 - Cable TV subscriptions and cord cutters. Refer to...Ch. 10.2 - Do social robots walk or roll? Refer to the...Ch. 10.2 - Rankings of MBA programs. Business Ethics (Fall...Ch. 10.2 - Museum management. Refer to the Museum Management...Ch. 10.2 - Offshoring companies. Offshoring is a term that...
Ch. 10.2 - Prob. 10.11ACICh. 10.2 - Prob. 10.12ACICh. 10.2 - Mobile device typing strategies. Text messaging on...Ch. 10.2 - Prob. 10.14ACICh. 10.2 - Coupon user study. A hot topic in marketing...Ch. 10.2 - Cell phone user survey. If you subscribe to a cell...Ch. 10.2 - Overloading in the trucking industry. Although...Ch. 10.2 - Political representation of religious groups. Do...Ch. 10.3 - Find the rejection region for a test of...Ch. 10.3 - Consider the 2 3 (i e., r = 2 and = 3)...Ch. 10.3 - Refer to Exercise 10.20. a. Convert the frequency...Ch. 10.3 - Test the null hypothesis of independence of the...Ch. 10.3 - Refer to Exercise 10.22. a. Convert the responses...Ch. 10.3 - Safety of hybrid cars. According to the Highway...Ch. 10.3 - Purchasing souvenirs. A major tourist activity is...Ch. 10.3 - Prob. 10.26ACBCh. 10.3 - Are travel professionals equitably paid? Business...Ch. 10.3 - Eyewitnesses and mugshots. Refer to the Applied...Ch. 10.3 - Package design influences taste. Can the package...Ch. 10.3 - Job satisfaction of women in construction. The...Ch. 10.3 - Offshoring companies. Refer to The Journal of...Ch. 10.3 - Prob. 10.32ACICh. 10.3 - Prob. 10.33ACICh. 10.3 - Prob. 10.34ACICh. 10.3 - Prob. 10.35ACICh. 10.3 - Prob. 10.36ACICh. 10.3 - Prob. 10.37ACICh. 10.3 - Coupon user study. Refer to the study of a...Ch. 10.3 - Examining the Monty Hall Dilemma. In Exercise...Ch. 10 - A random sample of 250 observations was classified...Ch. 10 - Prob. 10.41LMCh. 10 - Made in the USA survey. Refer to the Journal of...Ch. 10 - Prob. 10.43ACBCh. 10 - Survey on giving and volunteering (continued)....Ch. 10 - Stereotyping in deceptive and authentic news...Ch. 10 - Prob. 10.46ACBCh. 10 - Prob. 10.47ACICh. 10 - Pig farm study. An article in Sociological Methods...Ch. 10 - Management system failures. Refer to the Process...Ch. 10 - History of corporate acquisitions. Refer to the...Ch. 10 - Creating menus to influence others. Refer to the...Ch. 10 - Prob. 10.52ACICh. 10 - Prob. 10.53ACICh. 10 - Prob. 10.54ACICh. 10 - Flight lesponse of geese to helicopter traffic....Ch. 10 - Prob. 10.56ACACh. 10 - Goodness-of-fit test. A statistics analysis is to...Ch. 10 - Prob. 10.58CTCCh. 10 - A television station has hired an independent...Ch. 10 - Suppose the television station believes that a...Ch. 10 - Generalize the situations in Exercises 1 and 2 to...Ch. 10 - In this Activity, you will revisit Activity 3.1,...Ch. 10 - Prob. 10.2.2ACh. 10 - Perform a x2 test for independence for the example...
Knowledge Booster


Learn more about
Need a deep-dive on the concept behind this application? Look no further. Learn more about this topic, statistics and related others by exploring similar questions and additional content below.Similar questions
- Urban Travel Times Population of cities and driving times are related, as shown in the accompanying table, which shows the 1960 population N, in thousands, for several cities, together with the average time T, in minutes, sent by residents driving to work. City Population N Driving time T Los Angeles 6489 16.8 Pittsburgh 1804 12.6 Washington 1808 14.3 Hutchinson 38 6.1 Nashville 347 10.8 Tallahassee 48 7.3 An analysis of these data, along with data from 17 other cities in the United States and Canada, led to a power model of average driving time as a function of population. a Construct a power model of driving time in minutes as a function of population measured in thousands b Is average driving time in Pittsburgh more or less than would be expected from its population? c If you wish to move to a smaller city to reduce your average driving time to work by 25, how much smaller should the city be?arrow_forwardSuppose the marketing research firm would like to examine if the social networking site that a person primarily uses is influenced by his or her age. In a randomly drawn sample, 369 social network users were asked which site they primarily visited. At the 0.05 level of significance, can we conclude that the two variables are related? These data are presented in the following table along with each person’s age group: Age (Years) Facebook Twitter LinkedIn 10-17 7 22 0 18-34 44 54 25 35-54 40 38 44 55 and older 26 38 31 a. What test should you run? b. Select the correct hypothesis statements. H0: H1: c. Compute the value of the test statistic? (Round your answer to 2 decimal places. Negative values should have a minus sign in front of them) d. Determine the p-value (Round your final answer to 4 decimal places.) e. What is your decision regarding the null hypothesis? multiple choice Fail to reject the null. Reject the…arrow_forwardA low-level CDC bureaucrat wants to please his boss by gathering evidence thatthe current government-mandated shutdown of society is not causing people’s mentalhealth to deteriorate, so that it can safely be continued for several years if anyexpert says it’s necessary.He polls a random sample of 1600 citizens, gathering data on such items asincome loss, weight gain, access to toilet paper, hours spent binge-watchingNetflix, and number of injuries caused by household fights, and compiles all thisinto a scientifically-weighted “misery index”.The mean misery index from the sample is 99.2; it seems reasonable to use apopulation standard deviation σ = 19.1.a) Does this information provide significant evidence (at the 5% level) that thenationwide mean misery index is less than 100? Set up appropriate null andalternative hypotheses, calculate the appropriate test statistic, find the P-value,and state your conclusion. (10)b) A CDC press release publishing the results of this study claims that…arrow_forward
- A low-level CDC bureaucrat wants to please his boss by gathering evidence thatthe current government-mandated shutdown of society is not causing people’s mentalhealth to deteriorate, so that it can safely be continued for several years if anyexpert says it’s necessary.He polls a random sample of 1600 citizens, gathering data on such items asincome loss, weight gain, access to toilet paper, hours spent binge-watchingNetflix, and number of injuries caused by household fights, and compiles all thisinto a scientifically-weighted “misery index”.The mean misery index from the sample is 99.2; it seems reasonable to use apopulation standard deviation σ = 19.1.a) Does this information provide significant evidence (at the 5% level) that thenationwide mean misery index is less than 100? Set up appropriate null andalternative hypotheses, calculate the appropriate test statistic, find the P-value,and state your conclusion. b) A CDC press release publishing the results of this study claims that…arrow_forwardconsider that in a retrospective cohort study involving job type and heart disease among railroad workers, the following data was obtained. Note that job type was used as a surrogate marker for physical activity. Clerks have a sedentary job whereas track workers have a physically demanding job. Heart Disease Job Type Yes No Clerk 50 500 Tracks Worker 22 390 a)Calculate a measure of association between these variables? b) Interpret the results in Question a?arrow_forwardIn 2010, Seery, Holman, & Silver found that individuals with some history of adversity report better mental health and well-being compared to people with little to no history of adversity. In an attempt to examine this phenomenon, a researcher surveys a group of college students to determine the negative life events they experienced in the last 5 years and their current feeling of well-being. Participants: With 5-10 negative experiences With 2 or fewer negative experiences n=7 n=7 Well-being score of M=48 Well-being score of M=41 SS=325 SS=347 1. State the hypotheses both experimental and statistical 2. Do the results indicate significantly different reports of Well-being? Use a two-tailed test with a=.05. Please show work and state your decision regarding the H0. 3. Compute the estimated Cohen's d to measure the size of the effect. State…arrow_forward
arrow_back_ios
arrow_forward_ios
Recommended textbooks for you
 Functions and Change: A Modeling Approach to Coll...AlgebraISBN:9781337111348Author:Bruce Crauder, Benny Evans, Alan NoellPublisher:Cengage Learning
 Glencoe Algebra 1, Student Edition, 9780079039897...AlgebraISBN:9780079039897Author:CarterPublisher:McGraw Hill
Functions and Change: A Modeling Approach to Coll...
Algebra
ISBN:9781337111348
Author:Bruce Crauder, Benny Evans, Alan Noell
Publisher:Cengage Learning
Glencoe Algebra 1, Student Edition, 9780079039897...
Algebra
ISBN:9780079039897
Author:Carter
Publisher:McGraw Hill
Correlation Vs Regression: Difference Between them with definition & Comparison Chart; Author: Key Differences;https://www.youtube.com/watch?v=Ou2QGSJVd0U;License: Standard YouTube License, CC-BY
Correlation and Regression: Concepts with Illustrative examples; Author: LEARN & APPLY : Lean and Six Sigma;https://www.youtube.com/watch?v=xTpHD5WLuoA;License: Standard YouTube License, CC-BY