
Concept explainers
Videos
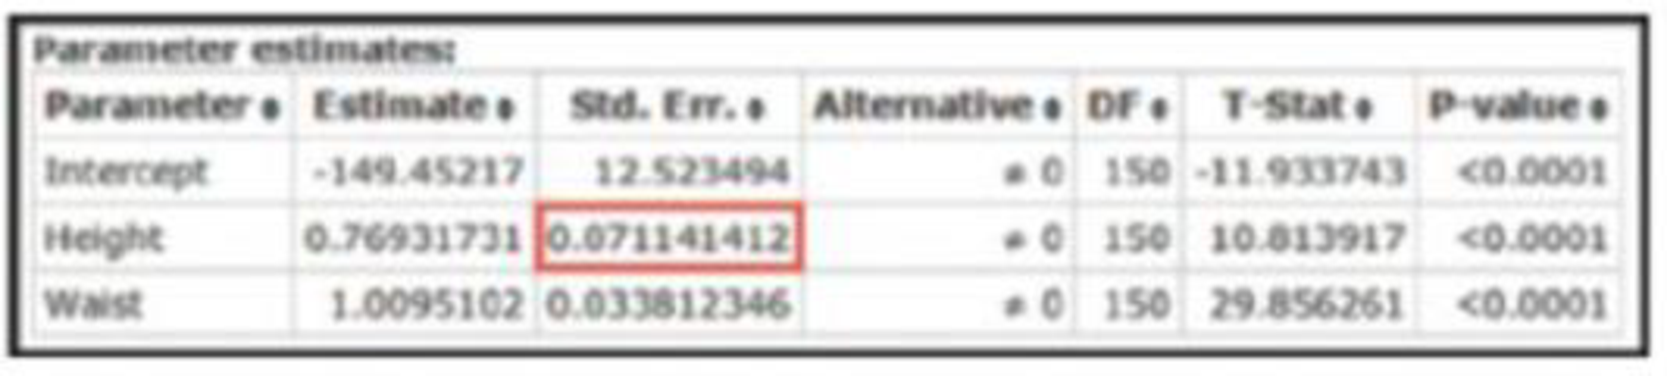
Testing Hypotheses About Regression Coefficients If the coefficient β1, has a nonzero value, then it is helpful in predicting the value of the response variable. If β1 = 0, it is not helpful in predicting the value of the response variable and can be eliminated from the regression equation. To test the claim that β1 = 0 use the test statistic t = (b1 − 0)/
Want to see the full answer?
Check out a sample textbook solution
Chapter 10 Solutions
ELEMENTARY STATISTICS-ACCESS >CUSTOM<


- Olympic Pole Vault The graph in Figure 7 indicates that in recent years the winning Olympic men’s pole vault height has fallen below the value predicted by the regression line in Example 2. This might have occurred because when the pole vault was a new event there was much room for improvement in vaulters’ performances, whereas now even the best training can produce only incremental advances. Let’s see whether concentrating on more recent results gives a better predictor of future records. (a) Use the data in Table 2 (page 176) to complete the table of winning pole vault heights shown in the margin. (Note that we are using x=0 to correspond to the year 1972, where this restricted data set begins.) (b) Find the regression line for the data in part ‚(a). (c) Plot the data and the regression line on the same axes. Does the regression line seem to provide a good model for the data? (d) What does the regression line predict as the winning pole vault height for the 2012 Olympics? Compare this predicted value to the actual 2012 winning height of 5.97 m, as described on page 177. Has this new regression line provided a better prediction than the line in Example 2?arrow_forwardXYZ Corporation Stock Prices The following table shows the average stock price, in dollars, of XYZ Corporation in the given month. Month Stock price January 2011 43.71 February 2011 44.22 March 2011 44.44 April 2011 45.17 May 2011 45.97 a. Find the equation of the regression line. Round the regression coefficients to three decimal places. b. Plot the data points and the regression line. c. Explain in practical terms the meaning of the slope of the regression line. d. Based on the trend of the regression line, what do you predict the stock price to be in January 2012? January 2013?arrow_forwardLife Expectancy The following table shows the average life expectancy, in years, of a child born in the given year42 Life expectancy 2005 77.6 2007 78.1 2009 78.5 2011 78.7 2013 78.8 a. Find the equation of the regression line, and explain the meaning of its slope. b. Plot the data points and the regression line. c. Explain in practical terms the meaning of the slope of the regression line. d. Based on the trend of the regression line, what do you predict as the life expectancy of a child born in 2019? e. Based on the trend of the regression line, what do you predict as the life expectancy of a child born in 1580?2300arrow_forward
- What is regression analysis? Describe the process of performing regression analysis on a graphing utility.arrow_forwardHow the most common use of a one-sided t-test is to determine whether a regression coefficient ?arrow_forwardObservations are taken on sales of a certain mountain bike in 30 sporting goods stores. The regression model was Y = total sales (thousands of dollars). X₁ = display floor space (square meters), X₂= competitors' advertising expenditures (thousands of dollars), X₁ = advertised price (dollars per unit). Predictor Intercept FloorSpace CompetingAds Price Coefficient 1,243.88 13.74 -6.848 -0.1461 (a) Write the fitted regression equation. (Round your coefficient CompetingAds to 3 decimal places, coefficient Price to 4 decimal places, and other values to 2 decimal places. Negative values should be indicated by a minus sign.) *FloorSpace+ *CompetingAds+ (b-1) The coefficient of FloorSpace says that each additional square foot of floor space O takes away 13.74 from sales (in thousands of dollars) O adds about 13.74 to sales (in thousands of dollars) adds about 6.848 to sales (in thousands of dollars) takes away 01496 from sales (in thousands of dollars) (b-2) The coefficient of CompetingAds…arrow_forward
- what is the regression equation for all predictors? Iarrow_forwardIn multiple regression analysis, explain why the typical hypothesis that analysts want to test is whether a particular regression coefficient (B) is equal to zero (H0: B = 0) versus whether that coefficient is not equal to zeroarrow_forwardIs the regression equation for predicting Y in terms of X the same as the regression line for predicting X in terms of Y?arrow_forward
- can you please help with questions a-e i need helparrow_forwardInterpret the least squares regression line of this data set. Meteorologists in a seaside town wanted to understand how their annual rainfall is affected by the temperature of coastal waters. For the past few years, they monitored the average temperature of coastal waters (in Celsius), x, as well as the annual rainfall (in millimetres), y. Rainfall statistics • The mean of the x-values is 11.503. • The mean of the y-values is 366.637. • The sample standard deviation of the x-values is 4.900. • The sample standard deviation of the y-values is 44.387. • The correlation coefficient of the data set is 0.896. The correct least squares regression line for the data set is: y = 8.116x + 273.273 Use it to complete the following sentence: The least squares regression line predicts an additional annual rainfall if the average temperature of coastal waters increases by one degree millimetres of Celsius.arrow_forwardFull IQ Score Refer to Data Set 7 “IQ and Lead” in Appendix B and find the best regression equation with IQ FULL (full IQ score) as the response (y) variable. Use predictor variables of IQ VERB (verbal IQ score) and IQ PERF (performance IQ score). Why is this equation best? Based on these results, can we predict someone’s full IQ score if we know their verbal IQ score and their performance IQ score? Is such a prediction likely to be very accurate?arrow_forward
 College AlgebraAlgebraISBN:9781305115545Author:James Stewart, Lothar Redlin, Saleem WatsonPublisher:Cengage Learning
 Functions and Change: A Modeling Approach to Coll...AlgebraISBN:9781337111348Author:Bruce Crauder, Benny Evans, Alan NoellPublisher:Cengage Learning
 Glencoe Algebra 1, Student Edition, 9780079039897...AlgebraISBN:9780079039897Author:CarterPublisher:McGraw Hill
 Algebra and Trigonometry (MindTap Course List)AlgebraISBN:9781305071742Author:James Stewart, Lothar Redlin, Saleem WatsonPublisher:Cengage Learning
 Big Ideas Math A Bridge To Success Algebra 1: Stu...AlgebraISBN:9781680331141Author:HOUGHTON MIFFLIN HARCOURTPublisher:Houghton Mifflin Harcourt