
Concept explainers
Videos
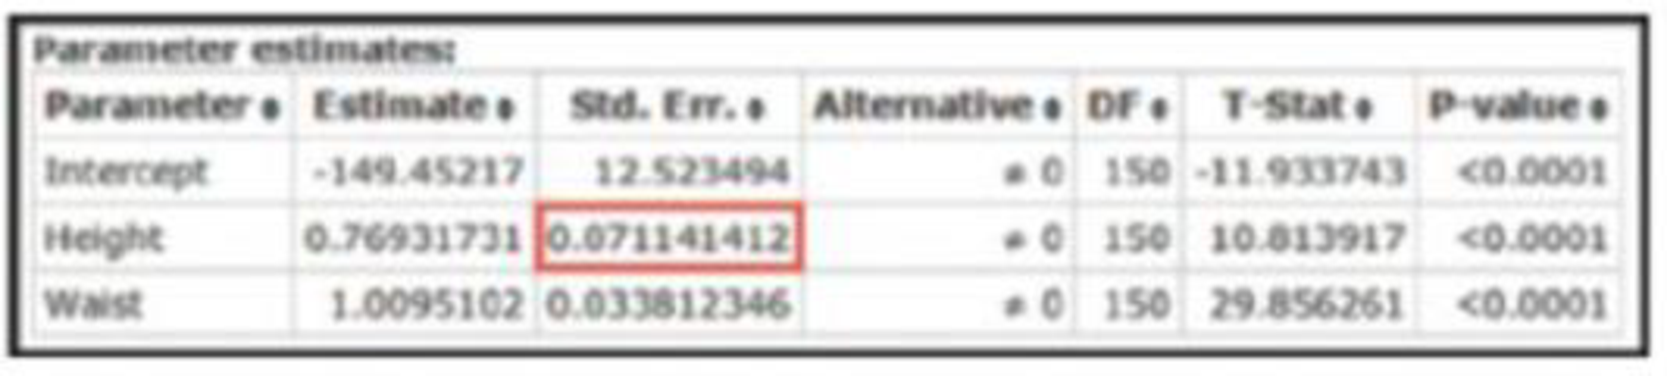
Testing Hypotheses About Regression Coefficients If the coefficient β1, has a nonzero value, then it is helpful in predicting the value of the response variable. If β1 = 0, it is not helpful in predicting the value of the response variable and can be eliminated from the regression equation. To test the claim that β1 = 0 use the test statistic t = (b1 − 0)/
Want to see the full answer?
Check out a sample textbook solution
Chapter 10 Solutions
MA 180 MYMATHLAB ACCESS


- In this section, we introduced a descriptive measure of the utility of the regression equation for making predictions. a. Identify the term and symbol for that descriptive measure. b. Provide an interpretation.arrow_forwardIn the information provided by a regression output… …the coefficients are used to predict the ‘y’ variable and we can use R-Squared, the F- Statistic, and t-statistics on x variable coefficients to determine the regression’s quality …the t-statistics on x variable coefficients are used to predict the ‘y’ variable and we can use R-Squared, coefficients, the F-Statistic, and to determine the regression’s quality … we can use R-Squared, the F-Statistic, and t-statistics on x variable coefficients to predict the ‘y’ variable and the coefficients are used to determine the regression’s quality …none of the answers above are correctarrow_forwardSTATISTICS True or False If the sample correlation coefficient between X and Y is positive, then the slope of the estimated regression line of Y on X will also be positive.arrow_forward
- Cobb-Douglas Production Function Estimate the Cobb-Douglas production function Q ¼ αLβ1Kβ2, where Q = output; L = labour input; K = capital input; and α, β1, and β2 are the parameters to be estimated. For the Cobb-Douglas production function, test whether the coefficients of capital and labour are statistically significant. For Cobb-Douglas production function, determine the percentage of the variation in output that is explained by the regression equation. For Cobb-Douglas production function, determine the labour and capital estimated parameters, and give an economic interpretation of each value. Determine whether this production function exhibits increasing, decreasing, or constant returns to scale. (Ignore the issue of statistical significance.)arrow_forward1. Perform regression analysis based on linear and logarithmic regression models for normal stress data (x-axis) and peak shear stress (y-axis). Show the calculation in tabular form. Also determine the value of the correlation coefficient of the two data 2. Determine the best regression between the two models. Show the calculation in tabular form.arrow_forwardMultiple regression analysis was used to study how an individual's income (Y in thousands of dollars) is influenced by age (X1 in years), level of education (X2 ranging from 1 to 5), and the person's gender (X3 where 0 =female and 1=male). The following is a partial result of computer output that was used on a sample of 20 individuals. Present the estimated regression equation and compute the coefficient of determination. Explain it. Use the t test to determine the significance of each independent variable. Let α = 0.05. (For each test, give the null and alternative hypotheses, test statistic, and conclusion.) Use the F test to determine whether or not the regression model is significant. Let α = 0.05. (For the test, give the null and alternative hypotheses, test statistic, and conclusion.) Does the estimated regression equation provide a good fit for the observed data? Explain it. Suppose a new person with X1=40, X2=4, X3=0. Use the estimated regression equation in part (a)…arrow_forward
- Consider a regression model. The coefficient of determination (R2) gives the proportion of the variability in the dependent variable that is explained by the regression equation. True Falsearrow_forwardA college faculty collected data on his studens' score in the first exam and their first quiz.Look for the image for table. Supposed that the value of regression constant is 9.1410114235and regression Coefficient is 0.90613879, try to interpret this or describe this data in an in-depth manner.Note: no calculation anymore, just interpretation of the data.Example of expected answer: The coefficient of determination gives the amount of variation in the model explained by the factor considered in the model. Here only 1.74% of the variation is explained by the independent variable. Therefore, we can conclude that the high school grade is not much associated with the general weighted average.arrow_forwardTesting the Effects of Tea on the Immune SystemWe have seen that drinking tea appears to offer a strong boost to the immune system. In a study extending the results,1 blood samples were taken on 5 participants before and after one week of drinking about five cups of tea a day (the participants did not drink tea before the study started). The before and after blood samples were exposed to e.coli bacteria, and production of interferon gamma, a molecule that fights bacteria, viruses, and tumors, was measured. Mean production went from 155 pg/mL before tea drinking to 448 pg/mL after tea drinking. The mean difference for the 5 subjects is 293 pg/mL with a standard deviation in the differences of 242. The paper implies that the use of the t-distribution is appropriate.Use the information to test whether mean production of interferon gamma as a response to bacteria is significantly higher after drinking tea than before drinking tea. Use a 5% significance level.1Adapted from Kamath, A., et.…arrow_forward
 Algebra and Trigonometry (MindTap Course List)AlgebraISBN:9781305071742Author:James Stewart, Lothar Redlin, Saleem WatsonPublisher:Cengage Learning