
Concept explainers
Videos
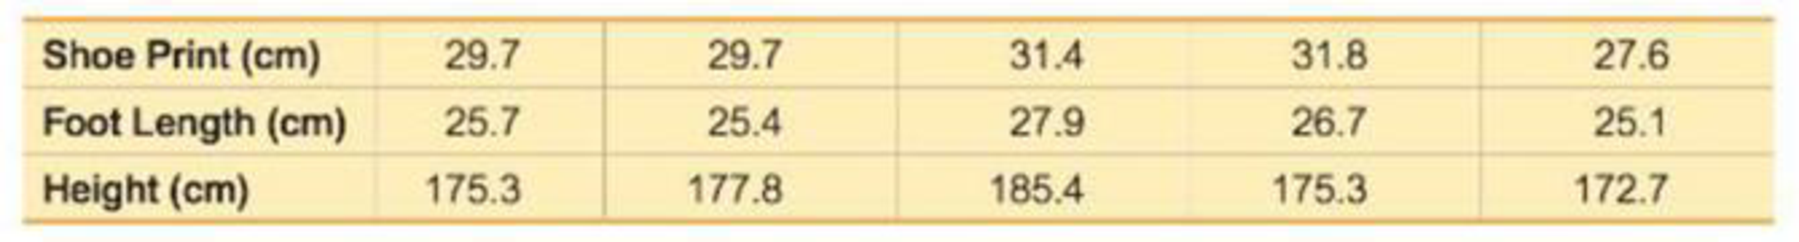
Regression and Predictions. Exercises 13–28 use the same data sets as Exercises 13–28 in Section 10-1. In each case, find the regression equation, letting the first variable be the predictor (x) variable, Find the indicated predicted value by following the prediction procedure summarized in Figure 10-5 on page 493.
17. CSI Statistics Use the shoe print lengths and heights to find the best predicted height of a male who has a shoe print length of 31.3 cm. Would the result be helpful to police crime scene investigators in trying to describe the male?
Want to see the full answer?
Check out a sample textbook solution
Chapter 10 Solutions
MA 180 MYMATHLAB ACCESS
Additional Math Textbook Solutions
Probability and Statistics for Engineering and the Sciences
Introductory Statistics
Fundamentals of Statistics (5th Edition)
Elementary Statistics
Elementary Statistics Using Excel (6th Edition)
STATISTICS F/BUSINESS+ECONOMICS-TEXT


- If the general linear regression model is given by the equation: y = a + b?; considering the informationobtained in Figure 2 above, compute the value of a.arrow_forwardRegression and Predictions. Exercises 13–28 use the same data sets as Exercises 13–28 in Section 10-1. In each case, find the regression equation, letting the first variable be the predictor (x) variable. Find the indicated predicted value by following the prediction procedure summarized in Figure 10-5 on page 493. Internet and Nobel Laureates Find the best predicted Nobel Laureate rate for Japan, which has 79.1 Internet users per 100 people. How does it compare to Japan’s Nobel Laureate rate of 1.5 per 10 million people?arrow_forwardChapter 5, Section 1, Exercise 019 MORE BENEFITS OF EATING ORGANICUsing specific data, we find a significant difference in the proportion of fruit flies surviving after 13 days between those eating organic potatoes and those eating conventional (not organic) potatoes. This exercise asks you to conduct a hypothesis test using additional data. In this case, we are testing H0 : po= pcHa: po > pc where po and pc represent the proportion of fruit flies alive at the end of the given time frame of those eating organic food and those eating conventional food, respectively. Use a 5% significance level.Effect of Organic Bananas After 25 DaysAfter 25 days, the proportion of fruit flies eating organic bananas still alive is 0.42, while the proportion still alive eating conventional bananas is 0.40. The standard error for the difference in proportions is 0.029.What is the value of the test statistic?Round your answer to two decimal places. z= What is the p-value?Round your answer to…arrow_forward
- Chapter 6, Section 4-D, Exercise 181 Use the formula to find the standard error of the distribution of differences in sample means, x¯1-x¯2.Samples of size 26 from Population 1 with mean 6.6 and standard deviation 4.0 and samples of size 44 from Population 2 with mean 8.5 and standard deviation 7.4Round your answer for the standard error to two decimal places.standard errorarrow_forwardAltman Z Score 2018 2019 2020 BHP 0.80 0.71 0.63 FMG 1.12 1.26 1.38 RIO 1.36 1.34 1.34 Comment on the findings of each company and is it useful in predicting financial failurearrow_forward2. Given the following sets of information, find the linear least squares regression and the correlation coefficient.arrow_forward
- All of the following models would be appropriate for data comprised of randomness and trend except: a. Holt’s exponential smoothing b. Holt-winter’s exponential smoothing c. Average change model d. Linear trend regression (time series decomposition) e. All of the above would be appropriatearrow_forwardSection 10.2 Question #8 Find the regression equation, letting the first variable be the predictor (x) variable. Using the listed lemon/crash data, where lemon imports are in metric tons and the fatality rates are per 100,000 people, find the best predicted crash fatality rate for a year in which there are 450metric tons of lemon imports. Is the prediction worthwhile? Lemon Imports 226 270 364 488 525 Crash Fatality Rate 16.1 15.9 15.6 15.5 15.1 Find the equation of the regression line. y= ___________+( ____________)x (Round the y-intercept to three decimal places as needed. Round the slope to four decimal places as needed.) The best predicted crash fatality rate for a year in which there are 450 metric tons of lemon imports is _________ fatalities per 100,000 population. (Round to one decimal place as needed.)arrow_forwardSection 10.2 Question #5 Use the given data to find the equation of the regression line. Examine the scatterplot and identify a characteristic of the data that is ignored by the regression line. x 7 10 8 9 12 14 13 5 11 6 4 y 8.11 10.67 9.27 10.12 10.86 9.82 10.49 4.89 10.91 6.66 2.82 y= ____________+ _____________x (Round to two decimal places as needed.)arrow_forward
- In Australia, 16% of the adult population is nearsighted.17 If three Australians are chosen at random, what is the probability that two are nearsighted and one is not? 2.state each of the five assumptions of the classical regression model (OLS) and give an intuitive explanation of the meaning and need for each of them.arrow_forwardThe quadratic regression equation shown below is for a sample of n=22. Determine the critical value(s).arrow_forwardFit a multiple linear regression model to the given data. as X1,X2,X5, and X6 as regressors.arrow_forward
 MATLAB: An Introduction with ApplicationsStatisticsISBN:9781119256830Author:Amos GilatPublisher:John Wiley & Sons Inc
 Probability and Statistics for Engineering and th...StatisticsISBN:9781305251809Author:Jay L. DevorePublisher:Cengage Learning
 Statistics for The Behavioral Sciences (MindTap C...StatisticsISBN:9781305504912Author:Frederick J Gravetter, Larry B. WallnauPublisher:Cengage Learning
 Elementary Statistics: Picturing the World (7th E...StatisticsISBN:9780134683416Author:Ron Larson, Betsy FarberPublisher:PEARSON
 The Basic Practice of StatisticsStatisticsISBN:9781319042578Author:David S. Moore, William I. Notz, Michael A. FlignerPublisher:W. H. Freeman
 Introduction to the Practice of StatisticsStatisticsISBN:9781319013387Author:David S. Moore, George P. McCabe, Bruce A. CraigPublisher:W. H. Freeman