
Videos
(a)
Check the variance of the first plot by using the calculator.
Check the variance of the second plot by using the calculator.
Find the level of significance.
State the null and alternative hypothesis.
(a)
Answer to Problem 5P
The level of significance is 0.01.
Null hypothesis:
Alternative hypothesis:
Explanation of Solution
Calculation:
Sample variance for first plot:
Use Ti 83 calculator to find the variance as follows:
- Select STAT > Edit > Enter the values of Wheat as L1.
- Click
- Click
- Click Enter.
Output using Ti 83 calculator is given below:
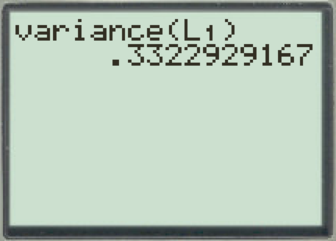
From the Ti 83 calculator output, the variance of the first plot is approximately 0.332.
Sample variance for second plot:
Use Ti 83 calculator to find the variance as follows:
- Select STAT > Edit > Enter the values of Wheat as L2.
- Click
- Click
- Click Enter.
Output using Ti 83 calculator is given below:
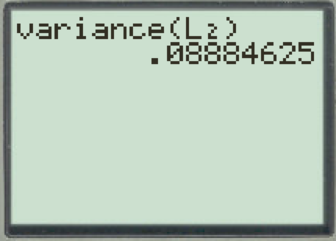
From the Ti 83 calculator output, the variance of the second plot is approximately 0.089.
The variance of the first plot is larger than second plot. The first plot must be considered as population 1 due to larger variance.
Let
From the given information the value of
Hence, the level of significance is 0.01.
The null and alternative hypothesis is,
Null hypothesis:
That is, the population variance of annual wheat production for the first plot is equal to the second plot.
Alternative hypothesis:
That is, the population variance of annual wheat production for the first plot is larger than that for the second plot.
(b)
Find the value of the sample F statistic.
Find the degrees of freedom.
Mention the assumptions made about the original distribution.
(b)
Answer to Problem 5P
The value of the sample F statistic is 3.73.
The degrees of freedom for annual wheat production for the first plot are 15.
The degrees of freedom for annual wheat production for the second plot are 15.
Explanation of Solution
Calculation:
Test statistic:
The sample test statistic is,
In the formula
Substitute 0.332 for
Hence, the value of the sample F statistic is 3.73.
Substitute 16 for
Hence, the degrees of freedom for annual wheat production for the first plot are 15.
Substitute 16 for
Hence, the degrees of freedom for annual wheat production for the second plot are 15.
The two populations are assumed to be independent and normally distributed. The samples are selected randomly from each of the population.
(c)
Find the P-value of the sample test statistic.
(c)
Answer to Problem 5P
The P-value of the sample test statistic is 0.0076.
Explanation of Solution
Calculation:
Step by step procedure to obtain P-value using MINITAB software is given below:
- Choose Graph > Probability Distribution Plot choose View Probability > OK.
- From Distribution, choose ‘F’ distribution.
- In Numerator df, enter the value as 15.
- In Denominator df, enter the value as 15.
- Click the Shaded Area tab.
- Choose X Value and Right Tail, for the region of the curve to shade.
- Enter the X value as 373.
- Click OK.
Output using MINITAB software is given below:
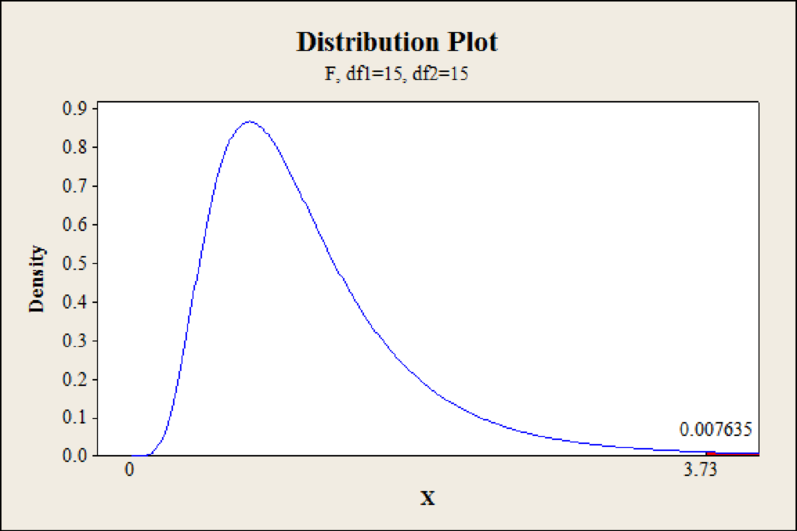
From Minitab output, the P-value is 0.0076.
Hence, the P-value of the sample test statistic is 0.0076.
(d)
Check whether the null hypothesis is rejected or fail to reject.
(d)
Answer to Problem 5P
The null hypothesis is rejected.
Explanation of Solution
Calculation:
From part (c), the P-value is 0.0076.
Rejection rule:
- If the P-value is less than or equal to
Conclusion:
The P-value is 0.0076 and the level of significance is 0.01.
The P-value is less than the level of significance.
That is,
By the rejection rule, the null hypothesis is rejected.
Hence, the null hypothesis is rejected.
(e)
Interpret the conclusion in the context of the application.
(e)
Explanation of Solution
Calculation:
From part (d), the null hypothesis is rejected. This shows that, there is sufficient evidence that the population variance of annual wheat production for the first plot is larger than that for the second plot at level of significance 0.01.
Want to see more full solutions like this?
Chapter 10 Solutions
UNDERSTANDABLE STATISTICS(LL)/ACCESS


 MATLAB: An Introduction with ApplicationsStatisticsISBN:9781119256830Author:Amos GilatPublisher:John Wiley & Sons Inc
 Probability and Statistics for Engineering and th...StatisticsISBN:9781305251809Author:Jay L. DevorePublisher:Cengage Learning
 Statistics for The Behavioral Sciences (MindTap C...StatisticsISBN:9781305504912Author:Frederick J Gravetter, Larry B. WallnauPublisher:Cengage Learning
 Elementary Statistics: Picturing the World (7th E...StatisticsISBN:9780134683416Author:Ron Larson, Betsy FarberPublisher:PEARSON
 The Basic Practice of StatisticsStatisticsISBN:9781319042578Author:David S. Moore, William I. Notz, Michael A. FlignerPublisher:W. H. Freeman
 Introduction to the Practice of StatisticsStatisticsISBN:9781319013387Author:David S. Moore, George P. McCabe, Bruce A. CraigPublisher:W. H. Freeman