
Videos
To graph: the given system of inequalities.
Explanation of Solution
Given information:
Calculation:
In inequality (1),
Thus, the interior part of parabola will be shaded.
Inequality (2)has less than or equal to sign. Thus, it represents a line whose graph will have a solid line. Now test a point which satisfies the inequality (2).
Thus, the region having true point will be shaded.
The graph of given system of inequalities is shown below.
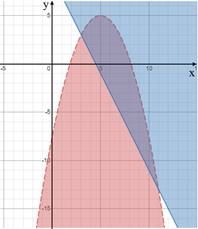
The red shaded portion represents inequality (1), the blue shaded portion represents inequality (2) and the region of intersection of two inequalities is shaded with light purple.
Chapter 10 Solutions
Advanced Mathematical Concepts: Precalculus with Applications, Student Edition
Additional Math Textbook Solutions
Calculus and Its Applications (11th Edition)
University Calculus: Early Transcendentals (3rd Edition)
Precalculus (10th Edition)
University Calculus: Early Transcendentals (4th Edition)
Precalculus


 Calculus: Early TranscendentalsCalculusISBN:9781285741550Author:James StewartPublisher:Cengage Learning
 Thomas' Calculus (14th Edition)CalculusISBN:9780134438986Author:Joel R. Hass, Christopher E. Heil, Maurice D. WeirPublisher:PEARSON
 Calculus: Early Transcendentals (3rd Edition)CalculusISBN:9780134763644Author:William L. Briggs, Lyle Cochran, Bernard Gillett, Eric SchulzPublisher:PEARSON
 Calculus: Early TranscendentalsCalculusISBN:9781319050740Author:Jon Rogawski, Colin Adams, Robert FranzosaPublisher:W. H. Freeman
 Calculus: Early Transcendental FunctionsCalculusISBN:9781337552516Author:Ron Larson, Bruce H. EdwardsPublisher:Cengage Learning