CengageNOWv2, 1 term Printed Access Card for Warren's Survey of Accounting, 8th
8th Edition
ISBN: 9781305961982
Author: Carl Warren
Publisher: Cengage Learning
expand_more
expand_more
format_list_bulleted
Concept explainers
Videos
Textbook Question
Chapter 11, Problem 11.2E
Identify cost graphs
The following cost graphs illustrate various types of cost behavior:
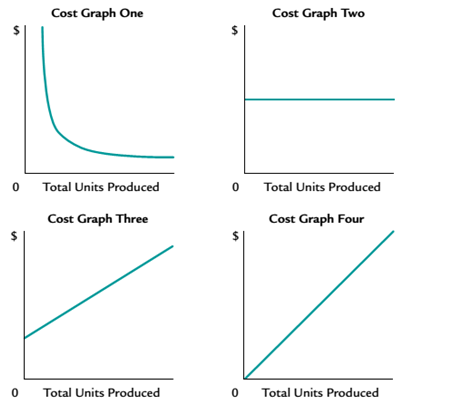
For each of the following costs, identify the cost graph that best illustrates its cost behavior as the number of units produced increases.
a. Direct material cost per unit.
b. Fees for using a patent of $500,000 plus $0.25 for each unit produced.
c. Salary of quality control supervisor.
d. Straight-line
e. Total direct materials cost.
Expert Solution & Answer
Want to see the full answer?
Check out a sample textbook solution
Chapter 11 Solutions
CengageNOWv2, 1 term Printed Access Card for Warren's Survey of Accounting, 8th
Ch. 11 - Which of the following statements describes...Ch. 11 - If sales are $500,000, variable costs are...Ch. 11 - If the unit selling price is $16. the unit...Ch. 11 - Based on the data presented in Question 3, how...Ch. 11 - Prob. 5SEQCh. 11 - Describe how total variable costs and unit...Ch. 11 - How would each of the following costs be...Ch. 11 - Describe the behavior of (a) total fixed costs and...Ch. 11 - How would each of the following costs be...Ch. 11 - In cost analyses, how arc mixed costs treated?
Ch. 11 - Which of the following graphs illustrates how...Ch. 11 - Which of the following graphs illustrates how unit...Ch. 11 - Which of the following graphs best illustrates...Ch. 11 - In applying the high-low method of Cost...Ch. 11 - Prob. 10CDQCh. 11 - Prob. 11CDQCh. 11 - Prob. 12CDQCh. 11 - If insurance rates are increased, what effect will...Ch. 11 - Prob. 14CDQCh. 11 - The reliability of cost-volume-profit (CVP)...Ch. 11 - How does the sales mix affect the calculation of...Ch. 11 - Prob. 17CDQCh. 11 - Classify costs Following is a list of various...Ch. 11 - Identify cost graphs The following cost graphs...Ch. 11 - Prob. 11.3ECh. 11 - Identify activity bases From the following list of...Ch. 11 - Identify fixed and variable costs Intuit Inc....Ch. 11 - Relevant range and fixed and variable costs Third...Ch. 11 - High-low method Liberty Inc. has decided to use...Ch. 11 - High-low method for service company Miss River...Ch. 11 - Contribution margin ratio a. Matzinger Company...Ch. 11 - Contribution margin and contribution margin ratio...Ch. 11 - Break-even sales and sales to realize operating...Ch. 11 - Prob. 11.12ECh. 11 - Prob. 11.13ECh. 11 - Break-even analysis The Garden Club of Palm...Ch. 11 - Break-even analysis Media outlets such as ESPN and...Ch. 11 - Prob. 11.16ECh. 11 - Prob. 11.17ECh. 11 - Prob. 11.18ECh. 11 - Prob. 11.19ECh. 11 - Prob. 11.20ECh. 11 - Break-even sales and sales mix for a service...Ch. 11 - Operating leverage SunRise Inc. and SunSet Inc....Ch. 11 - Classify costs Peak Apparel Co. manufactures a...Ch. 11 - Break-even sales under present and proposed...Ch. 11 - Prob. 11.2.2PCh. 11 - Prob. 11.2.3PCh. 11 - Prob. 11.2.4PCh. 11 - Prob. 11.2.5PCh. 11 - Break-even sales under present and proposed...Ch. 11 - Prob. 11.2.7PCh. 11 - Prob. 11.2.8PCh. 11 - Break-even sales and cost-volume-profit graph For...Ch. 11 - Prob. 11.3.2PCh. 11 - Break-even sales and cost-volume-profit graph For...Ch. 11 - Prob. 11.3.4PCh. 11 - Prob. 11.4.1PCh. 11 - Prob. 11.4.2PCh. 11 - Prob. 11.4.3PCh. 11 - Prob. 11.4.4PCh. 11 - Prob. 11.5.1PCh. 11 - Prob. 11.5.2PCh. 11 - Sales mix and break-even sales Data related to the...Ch. 11 - Prob. 11.5.4PCh. 11 - Prob. 11.5.5PCh. 11 - Contribution margin, break-even sales,...Ch. 11 - Contribution margin, break-even sales,...Ch. 11 - Contribution margin, break-even sales,...Ch. 11 - Contribution margin, break-even sales,...Ch. 11 - Contribution margin, break-even sales,...Ch. 11 - Margin of safety a. If Go-Go Buggies Company, with...Ch. 11 - Prob. 11.2MBACh. 11 - Margin of safety Use the data from E11-12 and...Ch. 11 - Margin of safety Use the data from E11-12 and...Ch. 11 - Sales mix and margin of safety Use the data from...Ch. 11 - Prob. 11.4.2MBACh. 11 - Prob. 11.4.3MBACh. 11 - Margin of safety Using the data from P11-2,...Ch. 11 - Prob. 11.5.2MBACh. 11 - Margin of safety Using the data from P11-6....Ch. 11 - Prob. 11.6.2MBACh. 11 - Prob. 11.6.3MBACh. 11 - Prob. 11.1CCh. 11 - Break-even sales, contribution margin "Every...Ch. 11 - Break-even analysis Aquarius Games Inc. has...Ch. 11 - Variable costs and activity bases in decision...Ch. 11 - Variable costs and activity bases in decision...Ch. 11 - Prob. 11.6C
Knowledge Booster


Learn more about
Need a deep-dive on the concept behind this application? Look no further. Learn more about this topic, accounting and related others by exploring similar questions and additional content below.Similar questions
- The cost behavior patterns below are lettered A through H. The vertical axes of the graphs represent total dollars of expense, and the horizontal axes represent production in units, machine hours, or direct labor hours. In each case, the zero point is at the intersection of the two axes. Each graph may be used no more than once. Required: Select the graph that matches the lettered cost described here. a. Depreciation of equipmentthe amount of depreciation charged is computed based on the number of machine hours that the equipment was operated. b. Electricity billflat fixed charge, plus a variable cost after a certain number of kilowatt hours are used. c. City water billcomputed as follows: d. Depreciation of equipmentthe amount is computed by the straight-line method. e. Rent on a factory building donated by the citythe agreement calls for a fixed fee payment, unless 200,000 labor hours are worked, in which case no rent need be paid. f. Salaries of repair workersone repair worker is needed for every 1,000 machine hours or less (i.e., 0 to 1,000 hours requires one repair worker, 1,001 to 2,000 hours requires two repair workers, etc.).arrow_forwardCost Classification Loring Company incurred the following costs last year: Required: 1. Classify each of the costs using the following table format. Be sure to total the amounts in each column. Example: Direct materials, 216,000. 2. What was the total product cost for last year? 3. What was the total period cost for last year? 4. If 30,000 units were produced last year, what was the unit product cost?arrow_forwardTo determine the effect of different levels of production on the company’s income, move to cell B7 (Actual production). Change the number in B7 to the different production levels given in the table below. The first level, 100,000, is the current level. What happens to the operating income on both statements as production levels change? Enter the operating incomes in the following table. Does the level of production affect income under either costing method? Explain your findings.arrow_forward
- The total cost for monthly supervisory cost in a factory is 4,500 regardless of how many hours the supervisor works or the quantity of output achieved. This cost a. is strictly variable. b. is strictly fixed. c. is a mixed cost. d. is a step cost. e. cannot be determined from this information.arrow_forwardWrappers Tape makes two products: Simple and Removable. It estimates it will produce 369,991 units of Simple and 146,100 of Removable, and the overhead for each of its cost pools is as follows: It has also estimated the activities for each cost driver as follows: Â How much is the overhead allocated to each unit of Simple and Removable?arrow_forwardGrand Canyon Manufacturing Inc. produces and sells a product with a price of 100 per unit. The following cost data have been prepared for its estimated upper and lower limits of activity: Overhead: Selling and administrative expenses: Required: 1. Classify each cost element as either variable, fixed, or semi-variable. (Hint: Recall that variable expenses must go up in direct proportion to changes in the volume of activity.) 2. Calculate the break-even point in units and dollars. (Hint: First use the high-low method illustrated in Chapter 4 to separate costs into their fixed and variable components.) 3. Prepare a break-even chart. 4. Prepare a contribution income statement, similar in format to the statement appearing on page 540, assuming sales of 5,000 units. 5. Recompute the break-even point in units, assuming that variable costs increase by 20% and fixed costs are reduced by 50,000.arrow_forward
- The following product costs are available for Stellis Company on the production of erasers: direct materials, $22,000; direct labor, $35,000; manufacturing overhead, $17,500; selling expenses, $17,600; and administrative expenses; $13,400. What are the prime costs? What are the conversion costs? What is the total product cost? What is the total period cost? If 13,750 equivalent units are produced, what is the equivalent material cost per unit? If 17,500 equivalent units are produced, what is the equivalent conversion cost per unit?arrow_forwardStep Costs, Relevant Range Bellati Inc. produces large industrial machinery. Bellati has a machining department and a group of direct laborers called machinists. Each machinist can machine up to 500 units per year. Bellati also hires supervisors to develop machine specification plans and oversee production within the machining department. Given the planning and supervisory work, a supervisor can oversee, at most, three machinists. Bellatis accounting and production history shows the following relationships between number of units produced and the annual costs of supervision and materials handling (by machinists): Required: 1. Prepare a graph that illustrates the relationship between direct labor cost and number of units produced in the machining department. (Let cost of direct labor be the vertical axis and number of units be the horizontal axis.) Would you classify this cost as a strictly variable cost, a fixed cost, or a step cost? 2. Prepare a graph that illustrates the relationship between the cost of supervision and the number of units produced. (Let cost of supervision be the vertical axis and number of units be the horizontal axis.) Would you classify this cost as a strictly variable cost, a fixed cost, or a step cost? 3. Suppose that the normal range of production is between 1,400 and 1,500 units and that the exact number of machinists is currently hired to support this level of activity. Further suppose that production for the next year is expected to increase by an additional 500 units. What is the increase in the cost of direct labor? Cost of supervision?arrow_forwardThe following product costs are available for Kellee Company on the production of eyeglass frames: direct materials, $32,125; direct labor, $23.50; manufacturing overhead, applied at 225% of direct labor cost; selling expenses, $22,225; and administrative expenses, $31,125. The direct labor hours worked for the month are 3,200 hours. A. What are the prime costs? B. What are the conversion costs? C. What is the total product cost? D. What is the total period cost? E. If 6.425 equivalent units are produced, what is the equivalent material cost per unit? F. What is the equivalent conversion cost per unit?arrow_forward
- Scattergraph method Using the data in P4-2 and a piece of graph paper: 1. Plot the data points on the graph and draw a line by visual inspection, indicating the trend shown by the data points. 2. Determine the variable cost per unit and the total fixed cost from the information on the graph. 3. Determine the variable cost to be charged to the product for the year. 4. Determine the fixed cost to be charged to factory overhead for the year. 5. Do these answers agree with the answers to P4-2? Why or why not?arrow_forward(Appendix 3A) Separating Fixed and Variable Costs, Service Setting Louise McDermott, controller for the Galvin plant of Veromar Inc., wanted to determine the cost behavior of moving materials throughout the plant. She accumulated the following data on the number of moves (from 100 to 800 in increments of 100) and the total cost of moving materials at those levels of moves: Required: 1. Prepare a scattergraph based on these data. Use cost for the vertical axis and number of moves for the horizontal axis. Based on an examination of the scattergraph, does there appear to be a linear relationship between the total cost of moving materials and the number of moves? 2. Compute the cost formula for moving materials by using the high-low method. Calculate the predicted cost for a month with 550 moves by using the high-low formula. (Note: Round the answer for the variable rate to three decimal places and the answer for total fixed cost and total cost to the nearest dollar.) 3. CONCEPTUAL CONNECTION Compute the cost formula for moving materials using the method of least squares. (Note: For the method of least squares, round the variable rate to two decimal places and total fixed cost and total cost to the nearest dollar.) Using the regression cost formula, what is the predicted cost for a month with 550 moves? What does the coefficient of determination tell you about the cost formula computed by regression? 4. CONCEPTUAL CONNECTION Evaluate the cost formula using the least squares coefficients. Could it be improved? Try dropping the third data point (300, 3,400), and rerun the regression.arrow_forwardCool Pool has these costs associated with production of 20,000 units of accessory products: direct materials, $70; direct labor, $110; variable manufacturing overhead, $45; total fixed manufacturing overhead, $800,000. What is the cost per unit under both the variable and absorption methods?arrow_forward
arrow_back_ios
SEE MORE QUESTIONS
arrow_forward_ios
Recommended textbooks for you
 Survey of Accounting (Accounting I)AccountingISBN:9781305961883Author:Carl WarrenPublisher:Cengage Learning
 Managerial AccountingAccountingISBN:9781337912020Author:Carl Warren, Ph.d. Cma William B. TaylerPublisher:South-Western College Pub
 Financial And Managerial AccountingAccountingISBN:9781337902663Author:WARREN, Carl S.Publisher:Cengage Learning,
 Principles of Accounting Volume 2AccountingISBN:9781947172609Author:OpenStaxPublisher:OpenStax College
 Managerial Accounting: The Cornerstone of Busines...AccountingISBN:9781337115773Author:Maryanne M. Mowen, Don R. Hansen, Dan L. HeitgerPublisher:Cengage Learning
 Cornerstones of Cost Management (Cornerstones Ser...AccountingISBN:9781305970663Author:Don R. Hansen, Maryanne M. MowenPublisher:Cengage Learning
Survey of Accounting (Accounting I)
Accounting
ISBN:9781305961883
Author:Carl Warren
Publisher:Cengage Learning
Managerial Accounting
Accounting
ISBN:9781337912020
Author:Carl Warren, Ph.d. Cma William B. Tayler
Publisher:South-Western College Pub
Financial And Managerial Accounting
Accounting
ISBN:9781337902663
Author:WARREN, Carl S.
Publisher:Cengage Learning,
Principles of Accounting Volume 2
Accounting
ISBN:9781947172609
Author:OpenStax
Publisher:OpenStax College
Managerial Accounting: The Cornerstone of Busines...
Accounting
ISBN:9781337115773
Author:Maryanne M. Mowen, Don R. Hansen, Dan L. Heitger
Publisher:Cengage Learning
Cornerstones of Cost Management (Cornerstones Ser...
Accounting
ISBN:9781305970663
Author:Don R. Hansen, Maryanne M. Mowen
Publisher:Cengage Learning
Cost Accounting - Definition, Purpose, Types, How it Works?; Author: WallStreetMojo;https://www.youtube.com/watch?v=AwrwUf8vYEY;License: Standard YouTube License, CC-BY