
(a)
To make your own Normal quantile plot of the data in Group
(a)
Explanation of Solution
In the question, the data is given that described of the effects of logging on counts in the Borneo rainforest as:
| Group 3 |
| 18 |
| 4 |
| 22 |
| 15 |
| 18 |
| 19 |
| 22 |
| 12 |
| 12 |
Thus, firstly we will sort the data from smallest to largest by using excel. That is first we will select the data and click the sort and filter option and then select ascending order. Thus, the result will be as:
| Group 3 |
| 4 |
| 12 |
| 12 |
| 15 |
| 18 |
| 18 |
| 19 |
| 22 |
| 22 |
Now we will use the R programming to construct the Normal quantile plot and scatterplot by using the codes as:
And the plots are as:
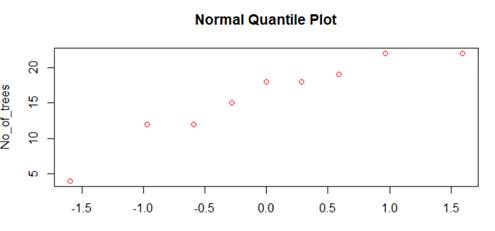
The above plot is Normal quantile plot which shows the Normality of the data and in this we can see that the points are approximately in a straight line and increasing.
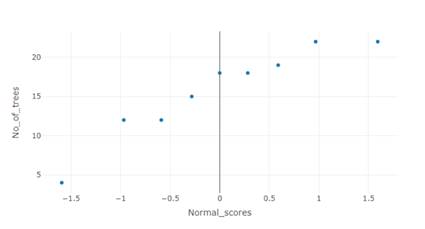
This is the scatterplot of the data which shows the increasing nature of the graph and it is also in a straight line.
(b)
To examine your Normal quantile plot for deviations from Normality and explain your conclusions.
(b)
Explanation of Solution
In the question, the data is given that described of the effects of logging on counts in the Borneo rainforest as:
| Group 3 |
| 18 |
| 4 |
| 22 |
| 15 |
| 18 |
| 19 |
| 22 |
| 12 |
| 12 |
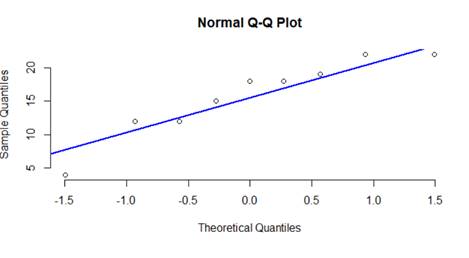
Thus, from the scatterplot in the part (a), we can say that if Normal scores increases the number of trees will also increase. The points seem to fail about a straight line and the x-axis plots the theoretical quantiles. Those are the quantiles from the standard
Want to see more full solutions like this?
Chapter 11 Solutions
Practice of Statistics in the Life Sciences

 MATLAB: An Introduction with ApplicationsStatisticsISBN:9781119256830Author:Amos GilatPublisher:John Wiley & Sons Inc
 Probability and Statistics for Engineering and th...StatisticsISBN:9781305251809Author:Jay L. DevorePublisher:Cengage Learning
 Statistics for The Behavioral Sciences (MindTap C...StatisticsISBN:9781305504912Author:Frederick J Gravetter, Larry B. WallnauPublisher:Cengage Learning
 Elementary Statistics: Picturing the World (7th E...StatisticsISBN:9780134683416Author:Ron Larson, Betsy FarberPublisher:PEARSON
 The Basic Practice of StatisticsStatisticsISBN:9781319042578Author:David S. Moore, William I. Notz, Michael A. FlignerPublisher:W. H. Freeman
 Introduction to the Practice of StatisticsStatisticsISBN:9781319013387Author:David S. Moore, George P. McCabe, Bruce A. CraigPublisher:W. H. Freeman