Introduction to Probability and Statistics
14th Edition
ISBN: 9781133103752
Author: Mendenhall, William
Publisher: Cengage Learning
bartleby

Videos

Question
Book Icon
Chapter 11, Problem 11.56SE

(a)

To determine

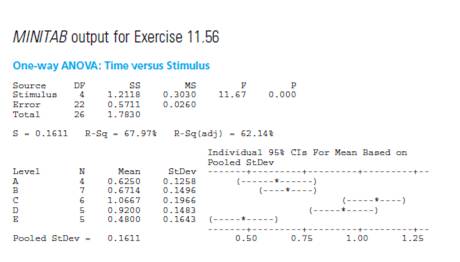
To conduct: an analysis of variance and test for a difference in the mean reaction times due to the five stimuli.

(a)

Expert Solution
Check Mark

Answer to Problem 11.56SE

The data provide sufficient evidence to indicate a difference in mean reaction times due to the five stimuli.

Explanation of Solution

Given:

    StimulusReaction Time (sec)TotalMean
    A
      .8

      .6

      .6

      .5

      2.5

      .625
    B
      .7

      .8

      .5

      .5

      .6

      .9

      .7

      4.7

      .671
    C
      1.2

      1.0

      .9

      1.2

      1.3

      .8

      6.4

      1.067
    D
      1.0

      .9

      .9

      1.1

      .7

      4.6

      .920
    E
      .6

      .4

      .4

      .7

      .3

      2.4

      .480

  Introduction to Probability and Statistics, Chapter 11, Problem 11.56SE

Calculation:

Now, we want to test there is any difference in mean reaction times.

To test the null hypothesis,

  H0:μ1=μ2=μ3=μ4=μ5 .

Versus the alternative hypothesis,

  Ha: At least one of the means is different from the others.

We have,

  MSE=0.3030MST=0.026

The test statistic is given by,

  F=MSTMSE=0.30300.026=11.67

Interpretation: The P-value from the above printout is 0.000 . Since, the Pvalue=0.000<α=.05 , we reject H0 .

Hence, we can conclude that the data provide sufficient evidence to indicate a difference in mean reaction times due to the five stimuli.

Conclusion: Therefore, the data provide sufficient evidence to indicate a difference in mean reaction times due to the five stimuli.

(b)

To determine

To compare: stimuli A and D to check whether there is a difference in mean reaction times.

(b)

Expert Solution
Check Mark

Answer to Problem 11.56SE

The data provide sufficient evidence to indicate a difference between μA and μD .

Explanation of Solution

Calculation:

We can test the null hypothesis,

  H0:μA=μD=0 .

Versus the alternative hypothesis,

  Ha:μA=μD0 .

Furthermore, the standard deviations of the two samples, calculated as

  sA=0.1258 , sD=0.1483 .

The pooled estimate of the common variance as,

  s2=(nA1)sA2+(nD1)sD2nA+nD2=(41)(0.015833)+(51)(0.022)4+52=0.0475+0.0887=0.13557s2=0.019357

We have,

  nA=4nD=5x¯A=0.625x¯D=0.92

The test statistic is given by,

  t=( x ¯A x ¯D) s 2 ( 1 n A + 1 n D )=(0.6250.92) 0.019357( 0.2+0.25 )=0.295 0.008710714=0.2950.093331207=3.160786283.16

We can find the appropriate critical value for a rejection region with α=.05 in Table 4 of Appendix I, and H0 will be rejected if t>2.365 . Comparing the observed value of the test statistic t=3.16 with the critical value t0.025=2.365 . And the P-value from the Minitab is Pvalue=0.016 . We can reject the null hypothesis. Hence we conclude that the data provide sufficient evidence to indicate a difference between μA and μD .

Conclusion: Hence we conclude that the data provide sufficient evidence to indicate a difference between μA and μD .

Want to see more full solutions like this?

Subscribe now to access step-by-step solutions to millions of textbook problems written by subject matter experts!

Chapter 11 Solutions

Introduction to Probability and Statistics

Ch. 11.5 - Prob. 11.11ECh. 11.5 - Assembling Electronic Equipment An experiment was...Ch. 11.5 - Prob. 11.13ECh. 11.5 - Prob. 11.14ECh. 11.5 - Prob. 11.16ECh. 11.5 - The Cost of Lumber A national home builder wants...Ch. 11.6 - Prob. 11.19ECh. 11.6 - Prob. 11.20ECh. 11.6 - Prob. 11.21ECh. 11.6 - Prob. 11.22ECh. 11.6 - Prob. 11.23ECh. 11.6 - Prob. 11.26ECh. 11.8 - Prob. 11.28ECh. 11.8 - Prob. 11.29ECh. 11.8 - Do the data of Exercise 11.28 provide sufficient...Ch. 11.8 - Prob. 11.31ECh. 11.8 - Prob. 11.32ECh. 11.8 - Prob. 11.34ECh. 11.8 - The partially completed ANOVA table for a...Ch. 11.8 - Gas Mileage A study was conducted to compare...Ch. 11.8 - Prob. 11.38ECh. 11.8 - Prob. 11.39ECh. 11.8 - Digitalis and Calcium Uptake A study was conducted...Ch. 11.8 - Bidding on Construction Jobs A building contractor...Ch. 11.8 - Premium Equity? The cost of auto insurance varies...Ch. 11.8 - Prob. 11.43ECh. 11.8 - Prob. 11.44ECh. 11.10 - Prob. 11.45ECh. 11.10 - Prob. 11.46ECh. 11.10 - Prob. 11.47ECh. 11.10 - Prob. 11.48ECh. 11.10 - Prob. 11.49ECh. 11.10 - Demand for Diamonds A chain of jewelry stores...Ch. 11.10 - Terrain Visualization A study was conducted to...Ch. 11.10 - Prob. 11.52ECh. 11.10 - Prob. 11.53ECh. 11.10 - Prob. 11.54ECh. 11.10 - Prob. 11.55ECh. 11 - Prob. 11.56SECh. 11 - Prob. 11.57SECh. 11 - Prob. 11.58SECh. 11 - Prob. 11.59SECh. 11 - Prob. 11.60SECh. 11 - Prob. 11.61SECh. 11 - Prob. 11.62SECh. 11 - Prob. 11.63SECh. 11 - Prob. 11.64SECh. 11 - Prob. 11.65SECh. 11 - Prob. 11.66SECh. 11 - Prob. 11.67SECh. 11 - Yield of Wheat The yields of wheat(in bushels per...Ch. 11 - Prob. 11.69SECh. 11 - Professor’s Salaries In a study of starting...Ch. 11 - Prob. 11.71SECh. 11 - Prob. 11.72SECh. 11 - Prob. 11.73SECh. 11 - Prob. 11.74SE
Knowledge Booster
Background pattern image
Statistics
Learn more about
Need a deep-dive on the concept behind this application? Look no further. Learn more about this topic, statistics and related others by exploring similar questions and additional content below.
Recommended textbooks for you
Text book image
Glencoe Algebra 1, Student Edition, 9780079039897...
Algebra
ISBN:9780079039897
Author:Carter
Publisher:McGraw Hill
Hypothesis Testing using Confidence Interval Approach; Author: BUM2413 Applied Statistics UMP;https://www.youtube.com/watch?v=Hq1l3e9pLyY;License: Standard YouTube License, CC-BY
Hypothesis Testing - Difference of Two Means - Student's -Distribution & Normal Distribution; Author: The Organic Chemistry Tutor;https://www.youtube.com/watch?v=UcZwyzwWU7o;License: Standard Youtube License