Introduction to Probability and Statistics
14th Edition
ISBN: 9781133103752
Author: Mendenhall, William
Publisher: Cengage Learning
bartleby

Concept explainers

bartleby

Videos

Textbook Question
Book Icon
Chapter 11.10, Problem 11.51E

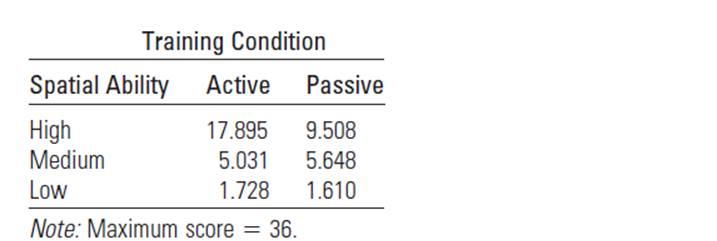
Terrain Visualization A study was conducted to determine the effect of two lactors on terrain visualization training for soldiers.4 During the raining programs. participants viewed contour maps of various terrains and then were permitted to view a computer reconstruction of the terrain as it would appear from a specified angle. The two factors investig ated in the experiment were the participants’ spatial abilities (abilities to visualize in three dimensions) and the viewing procedures (active or passive). Active participat ion permitted participants to view the computer— generated reconstructions of the terrain from any and all angles. Passive participation gave the participants a set of preselected reconstructions of the terrain. Participants were tested according to spatial ability, and from the test scores 20 were categorized as possessing high spatialability. 20 medium. and 20 low. Then 10 participants within each of these groups were assigned to each of the two training modes, active or passive. The accompanying tables are the ANOVA table computed by the researchers and the table of the treatment means.
Chapter 11.10, Problem 11.51E, Terrain Visualization A study was conducted to determine the effect of two lactors on terrain , example  1
Chapter 11.10, Problem 11.51E, Terrain Visualization A study was conducted to determine the effect of two lactors on terrain , example  2

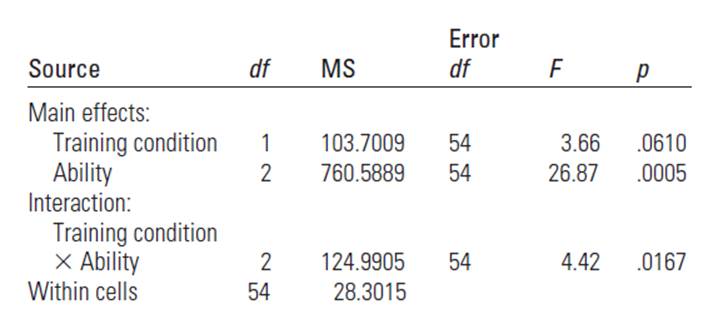
a. Explain how the authors arrived at the degrees of freedom shown in the ANOVA table.

b. Are the F-values correct?

c. Interpret the test results. What are their practical implications?

d. Use Table 6 in Appendix I to approximate the p-values for the F statistics shown in the ANOVA table.

Source: H.F. Barsam and Z.M. Simutis. “Computer-Based Graphics for Terrain Visualization Training. Human Factors, no. 26, 1984. Copyright 1984 by the Human Factors Society. Inc. Reproduced by permission.

Blurred answer

Chapter 11 Solutions

Introduction to Probability and Statistics

Ch. 11.5 - Prob. 11.11ECh. 11.5 - Assembling Electronic Equipment An experiment was...Ch. 11.5 - Prob. 11.13ECh. 11.5 - Prob. 11.14ECh. 11.5 - Prob. 11.16ECh. 11.5 - The Cost of Lumber A national home builder wants...Ch. 11.6 - Prob. 11.19ECh. 11.6 - Prob. 11.20ECh. 11.6 - Prob. 11.21ECh. 11.6 - Prob. 11.22ECh. 11.6 - Prob. 11.23ECh. 11.6 - Prob. 11.26ECh. 11.8 - Prob. 11.28ECh. 11.8 - Prob. 11.29ECh. 11.8 - Do the data of Exercise 11.28 provide sufficient...Ch. 11.8 - Prob. 11.31ECh. 11.8 - Prob. 11.32ECh. 11.8 - Prob. 11.34ECh. 11.8 - The partially completed ANOVA table for a...Ch. 11.8 - Gas Mileage A study was conducted to compare...Ch. 11.8 - Prob. 11.38ECh. 11.8 - Prob. 11.39ECh. 11.8 - Digitalis and Calcium Uptake A study was conducted...Ch. 11.8 - Bidding on Construction Jobs A building contractor...Ch. 11.8 - Premium Equity? The cost of auto insurance varies...Ch. 11.8 - Prob. 11.43ECh. 11.8 - Prob. 11.44ECh. 11.10 - Prob. 11.45ECh. 11.10 - Prob. 11.46ECh. 11.10 - Prob. 11.47ECh. 11.10 - Prob. 11.48ECh. 11.10 - Prob. 11.49ECh. 11.10 - Demand for Diamonds A chain of jewelry stores...Ch. 11.10 - Terrain Visualization A study was conducted to...Ch. 11.10 - Prob. 11.52ECh. 11.10 - Prob. 11.53ECh. 11.10 - Prob. 11.54ECh. 11.10 - Prob. 11.55ECh. 11 - Prob. 11.56SECh. 11 - Prob. 11.57SECh. 11 - Prob. 11.58SECh. 11 - Prob. 11.59SECh. 11 - Prob. 11.60SECh. 11 - Prob. 11.61SECh. 11 - Prob. 11.62SECh. 11 - Prob. 11.63SECh. 11 - Prob. 11.64SECh. 11 - Prob. 11.65SECh. 11 - Prob. 11.66SECh. 11 - Prob. 11.67SECh. 11 - Yield of Wheat The yields of wheat(in bushels per...Ch. 11 - Prob. 11.69SECh. 11 - Professor’s Salaries In a study of starting...Ch. 11 - Prob. 11.71SECh. 11 - Prob. 11.72SECh. 11 - Prob. 11.73SECh. 11 - Prob. 11.74SE
Knowledge Booster
Background pattern image
Statistics
Learn more about
Need a deep-dive on the concept behind this application? Look no further. Learn more about this topic, statistics and related others by exploring similar questions and additional content below.
Recommended textbooks for you
Text book image
Algebra & Trigonometry with Analytic Geometry
Algebra
ISBN:9781133382119
Author:Swokowski
Publisher:Cengage
Correlation Vs Regression: Difference Between them with definition & Comparison Chart; Author: Key Differences;https://www.youtube.com/watch?v=Ou2QGSJVd0U;License: Standard YouTube License, CC-BY
Correlation and Regression: Concepts with Illustrative examples; Author: LEARN & APPLY : Lean and Six Sigma;https://www.youtube.com/watch?v=xTpHD5WLuoA;License: Standard YouTube License, CC-BY