
Videos
DECISION MAKING ACROSS THE ORGANIZATION
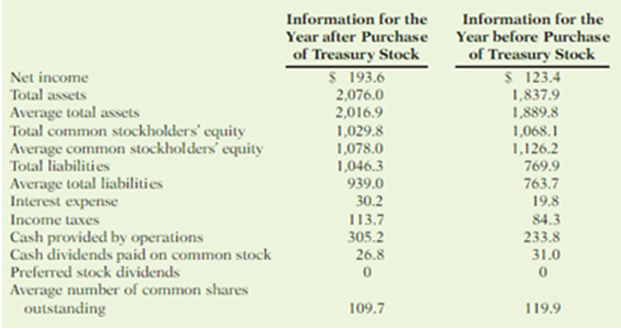
During a recent period, the fast-food drain Wendy’s International purchased many treasury shares. This caused the number of shares outstanding to fall from 124 million to 105 million. The following information was drawn from the company’s financial statements (in millions).
Instructions
Use the information provided to answer the following questions.
(a) Compute earnings per share, return on common stockholders’ equity and return on assets for both years. Discuss the change in the company’s profitability over this period.
(b) Compute the dividend payout ratio. Also compute the average cash dividend paid per share of common stock (dividends paid divided by the average number of common shares outstanding). Discuss any change in these ratios during this period and the implications for the company’s dividend policy.
(c) Compute the debt to assets ratio and limes interest earned. Discuss the change in the company’s solvency.
(d) Based on your findings in (a) and (c), discuss to what extent any change in lie return on common stockholders’ equity was tire result of increased reliance on debt.
(e) Does it appear that the purchase of
(a)
Financial Ratios: Financial ratios are the metrics used to evaluate the overall financial performance of a company during a specific period of time.
To compute: the earnings per share for year ended after and before purchase of treasury stock.
Answer to Problem 11.6EYCT
Calculate the earnings per share for W International.
For year ended after purchase of treasury stock
For year ended before purchase of treasury stock
Explanation of Solution
Earnings per share (EPS) refers to the share of earnings earned by the shareholder on each owned. The formula to calculate the earnings per share is as follows:
Therefore, the earnings per share for year ended after purchase of treasury stock is $1.76 per share and for year ended before purchase of treasury stock is $1.03 per share.
To Compute: the return on common stockholders’ equity for year ended after and before purchase of treasury stock.
Answer to Problem 11.6EYCT
Compute the return on common stockholders’ equity for W International:
For year ended after purchase of treasury stock
For year ended before purchase of treasury stock
Explanation of Solution
Return on common stockholders’ equity ratio: It is a profitability ratio that measures the profit generating ability of the company from the invested money of the shareholders. The formula to calculate the return on common stockholders’ equity is as follows:
Therefore, the Return on Common Stockholders’ equity for year ended after purchase of treasury stock is 18% and, for year ended before purchase of treasury stock is 11%.
To Compute: the return on assets ratio for year ended after and before purchase of treasury stock.
Answer to Problem 11.6EYCT
Compute the return on assets ratio:
For year ended after purchase of treasury stock.
For year ended before purchase of treasury stock.
Explanation of Solution
Return on assets is used to measure the overall earning ability of the company. Thus, it shows the relationship between the net income and the average total assets.
The formula to calculate the return on assets ratio is as follows:
Therefore, the Return on assets for year ended after purchase of treasury stock is 9.6% and, for year ended before purchase of treasury stock is 6.5%.
To discuss: the change in the company’s profitability over this period.
Explanation of Solution
The change in the company’s profitability over this period is discussed below:
- The purchase of treasury stock increased the earnings per share from $1.03 per share to $1.76 per share thereby reducing the number of outstanding shares in the for the year ended after the purchase of treasury stock.
- The return on common stockholders’ equity increased from 11% to 18% after the purchase of treasury stock due to increased return on assets from 6.5% to 9.6%. This implies that the company is able to earn more on the money invested on assets than interest paying on its borrowings.
- Thus, the above explanations imply that the purchase of treasury stock has increased the profitability of W International.
(b)
To Compute: the payout ratio for year ended after and before purchase of treasury stock.
Answer to Problem 11.6EYCT
Compute the payout ratio for W International:
For year ended after purchase of treasury stock
For year ended after purchase of treasury stock
Explanation of Solution
Payout Ratio: It refers to a measure that evaluates the amount of dividends paid to the shareholders out of the net income earned by a corporation. It is generally expressed as a percentage. The formula to calculate the payout ratio is as follows:
Therefore, the Payout ratio for year ended after purchase of treasury stock is 13.8% and, for year ended before purchase of treasury stock is 25.1%.
To Compute: the average cash dividend paid per share for year ended after and before purchase of treasury stock.
Answer to Problem 11.6EYCT
Compute the average cash dividend paid per share for W International:
For year ended after purchase of treasury stock
For year ended after purchase of treasury stock
Explanation of Solution
Average cash dividend paid per share: It refers to a measure that evaluates the amount of cash dividend paid on each share owned by the common shareholders out of the total cash dividends paid by a corporation. The formula to calculate the average cash dividend paid per share as follows:
Therefore, the average cash dividend paid per share for year ended after purchase of treasury stock is $0.24 per share and, for year ended before purchase of treasury stock is $0.26 per share.
To discuss: the change in these ratios during this period and the implications for the company’s dividend policy.
Explanation of Solution
After the purchase of treasury stock, the company has paid lesser dividends to its common stockholders as compared to before the purchase of treasury stock. Thus, it implies that the company is intentionally retained its earnings for investing in operations.
(c)
To Compute: the debt to assets ratio for year ended after and before purchase of treasury stock.
Answer to Problem 11.6EYCT
Compute the debt to assets ratio for W International:
For year ended after purchase of treasury stock.
For year ended before purchase of treasury stock.
Explanation of Solution
Debt to assets ratio: It is the ratio that measures the ability of a company to meet its long-term obligations out of its total assets available. It shows the relationship of total liabilities and total assets.
The formula to calculate the debt to assets ratio is as follows:
Therefore, the Debt to assets ratio for year ended after purchase of treasury stock is 50.4% and, for year ended before purchase of treasury stock is 41.9%.
To Compute: the times interest earned ratio for year ended after and before purchase of treasury stock.
Answer to Problem 11.6EYCT
Calculate the times interest earned ratio for W International:
For year ended after purchase of treasury stock.
For year ended after purchase of treasury stock.
Explanation of Solution
Times interest earned ratio: This ratio that measures a company’s ability to meet its interest payments with its available earnings.
The formula to calculate the times interest earned ratio is as follows:
Therefore, the Times interest earned ratio for year ended after purchase of treasury stock is 11.2 times and, for year ended before purchase of treasury stock is 11.5times.
To discuss: the change in company’s solvency.
Explanation of Solution
The change in company’s solvency is discussed below:
- Although the purchase of treasury stock has increased the profitability of the company but reduced its solvency.
- The company has increased the debts to assets ratio from 41.9% to 50.4% that decreased the solvency rate.
- The times interest earned ratio also slightly decreased from 11.5 times to 11.2 times due to the increase in interest expenses.
- Thus, this decrease in solvency might not much worry the investors.
(d)
To discuss: to what extent the increased reliance on debts changes in the return on common stockholders’ equity.
Explanation of Solution
As from the above calculated ratios, it is seen that there is an increase in both return on assets and return on common stockholders’ equity. Thus, it can be implied that the increased reliance and debt financing as well as the increased return on assets lead to the increase in the return on common stockholders’ equity.
(e)
To explain: whether the purchase of treasury stock and the reliance on debt financing was a wise strategic move.
Explanation of Solution
From the above calculated ratios, it is found that all the calculated ratios showed an improvement after the purchase of treasury stock. Thus, it indicates that the company has effectively used its available resources to increase its profitability significantly. However, there is seen a slight decrease in solvency rate and hence, it should not be a matter of concern for the company. It can smoothly handle its debt payments.
Therefore, it can be concluded that the purchase of treasury stock and the reliance on debt financing was a wise strategic move for W International.
Want to see more full solutions like this?
Chapter 11 Solutions
FINANCIAL ACCT.:TOOLS...(LL)-W/ACCESS


- Mike Sanders is considering the purchase of Kepler Company, a firm specializing in the manufacture of office supplies. To be able to assess the financial capabilities of the company, Mike has been given the companys financial statements for the 2 most recent years. Required: Note: Round all answers to two decimal places. 1. Compute the following for each year: (a) return on assets, (b) return on stockholders equity, (c) earnings per share, (d) price-earnings ratio, (e) dividend yield, and (f ) dividend payout ratio. 2. CONCEPTUAL CONNECTION Based on the analysis in Requirement 1, would you invest in the common stock of Kepler?arrow_forwardFor a recent year, OfficeMax and Staples are two companies competing in the retail office supply business. OfficeMax had a net income of 34,894,000, while Staples had a net loss of 210,706,000. OfficeMax had preferred stock of 28,726,000 with preferred dividends of 2,123,000. Staples had no preferred stock. The average outstanding common shares for each company were as follows: a. Determine the earnings per share for each company. Round to the nearest cent. b. Evaluate the relative profitability of the two companies.arrow_forwardRebert Inc. showed the following balances for last year: Reberts net income for last year was 3,182,000. Refer to the information for Rebert Inc. above. Also, assume that the market price per share for Rebert is 51.50. Required: 1. Compute the dollar amount of preferred dividends. 2. Compute the number of common shares. 3. Compute earnings per share. (Note: Round to two decimals.) 4. Compute the price-earnings ratio. (Note: Round to the nearest whole number.)arrow_forward
- Rebert Inc. showed the following balances for last year: Reberts net income for last year was 3,182,000. Refer to the information for Rebert Inc. above. Also, assume that the dividends paid to common stockholders for last year were 2,600,000 and that the market price per share of common stock is 51.50. Required: 1. Compute the dividends per share. 2. Compute the dividend yield. (Note: Round to two decimal places.) 3. Compute the dividend payout ratio. (Note: Round to two decimal places.)arrow_forwardI need help creating some type of formula that will help me in solving thesse types of problems? At the beginning of the year, Monty Company had total assets of $819,000 and total liabilities of $442,000. Answer the following questions. (a) If total assets increased $164,000 during the year and total liabilities decreased $64,000, what is the amount of stockholders’ equity at the end of the year? Stockholders’ equity $ (b) During the year, total liabilities increased $112,000 and stockholders’ equity decreased $61,000. What is the amount of total assets at the end of the year? Total assets $ (c) If total assets decreased $54,000 and and owner’s equity increased $105,000 during the year, what is the amount of total liabilities at the end of the year? Total liabilities $arrow_forwardEthics and the Manager M. K. Gallant is president of Kranbrack Corporation, a company whose stock is traded on a national exchange. In a meeting with investment analysts at the beginning of the year, Gallant had predicted that the company’s earnings would grow by 20% this year. Unfortunately, sales have been less than expected for the year, and Gallant concluded within two weeks of the end of the fiscal year that it would be impossible to report an increase in earnings as large as predicted unless some drastic action was taken. Accordingly, Gallant has ordered that wherever possible, expenditures should be postponed to the new year—including canceling or postponing orders with suppliers, delaying planned maintenance and training, and cutting back on end-of-year advertising and travel. Additionally, Gallant ordered the company’s controller to carefully scrutinize all costs that are currently classified as period costs and reclassify as many as possible as product costs that are…arrow_forward
- Please show working for each question 1. In its most recent financial statements, Nessler Inc. reported $50 million of net income and $550 million of retained earnings. The previous retained earnings were $512 million. How much in dividends were paid to shareholders during the year? Assume that all dividends declared were actually paid. Write out your answer completely. For example, 25 million should be entered as 25,000,000. Round your answer to the nearest dollar, if necessary. 2. Byron Books Inc. recently reported $6 million of net income. Its EBIT was $12.6 million, and its tax rate was 40%. What was its interest expense? (Hint: Write out the headings for an income statement, and then fill in the known values. Then divide $6 million of net income by (1 - T) = 0.6 to find the pretax income. The difference between EBIT and taxable income must be interest expense. Use this same procedure to complete similar problems.) Write out your answer completely. For example, 25 million should…arrow_forwardI'm struggling with figuring up the second part to the balances, please help me. Statement of stockholders’ equity Noric Cruises Inc. began the month of October with the following balances: Common Stock, $160,000; Additional Paid-In Capital, $3,025,000; and Retained Earnings, $12,600,000. During June, Noric issued for cash 50,000 shares of common stock (with a stated value of $1) at $15 per share. Noric reported the following results for the month ended October 31: Net income $2,200,000 Cash dividends declared 465,000 Prepare a statement of stockholders’ equity for the month ended October 31. If there is a net loss or there has been a decrease in stockholders' equity, enter that amount as a negative number using a minus sign. If an amount box does not require an entry, leave it blank.arrow_forwardDuring the current year, the total assets of Mifflinburg Corporation decreased by $60,000 and totalliabilities decreased by $300,000. The company issued $100,000 of new stock, and its net incomefor the year was $250,000. No other changes to stockholders’ equity occurred during the year.Determine the dollar amount of dividends declared by the company during the year.arrow_forward
- Please help me solve numbers 1,2,3 and 4 on the screen shot. And below are the financial statements. Thank you Comparative financial statements for Weller Corporation, a merchandising company, for the year ending December 31 appear below. The company did not issue any new common stock during the year. A total of 960,000 shares of common stock were outstanding. The interest rate on the bonds, which were sold at their face value, was 12%. The income tax rate was 40% and the dividend per share of common stock was $0.40 this year. The market value of the company’s common stock at the end of the year was $26. All of the company’s sales are on account. Weller CorporationComparative Balance Sheet(dollars in thousands) This Year Last Year Assets Current assets: Cash $ 2,036 $ 3,020 Accounts receivable, net 16,000 9,050 Inventory 10,500 8,840 Prepaid expenses 1,960 2,420…arrow_forwardLast year Kendall Enterprises (KE) had earnings per share of $5 and dividends per share of $2. Total retained earnings increased by $12 million during the year, while book value per share at year-end was $40. KE has no preferred stock, and no new common stock was issued during the year. If its year-end total debt was $120 million, 1)what was the company’s year-end # of shares outstanding? 2)what was the company’s total common equity? 3)what was the company’s total debt to total capital ratio?arrow_forwardThe annual report for Malibu Beachwear reported the following transactions affecting stockholders’ equity: Purchased $351,300 of common stock now held in treasury. Declared cash dividends in the amount of $260,650. Paid the dividends in (b). Issued 113,000 new shares of $0.10 par value common shares for $2 per share. Closed the Dividends account. Required: Indicate the effect (+ for increase, − for decrease, +/− for increase/decrease) of each of these transactions on total assets, liabilities, and stockholders’ equity. (Leave cell blank if there is no effect.)arrow_forward
 Managerial Accounting: The Cornerstone of Busines...AccountingISBN:9781337115773Author:Maryanne M. Mowen, Don R. Hansen, Dan L. HeitgerPublisher:Cengage Learning
 Financial AccountingAccountingISBN:9781337272124Author:Carl Warren, James M. Reeve, Jonathan DuchacPublisher:Cengage Learning
 Financial AccountingAccountingISBN:9781305088436Author:Carl Warren, Jim Reeve, Jonathan DuchacPublisher:Cengage Learning