
Loose Leaf for Corporate Finance (Mcgraw-hill/Irwin Series in Finance, Insurance, and Real Estate)
11th Edition
ISBN: 9781259709685
Author: Stephen A. Ross Franco Modigliani Professor of Financial Economics Professor, Randolph W Westerfield Robert R. Dockson Deans Chair in Bus. Admin., Jeffrey Jaffe
Publisher: McGraw-Hill Education
expand_more
expand_more
format_list_bulleted
Concept explainers
Videos
Textbook Question
Chapter 11, Problem 29QP
Correlation and Beta You have been provided the following data about the securities of three firms, the market portfolio, and the risk-free asset:
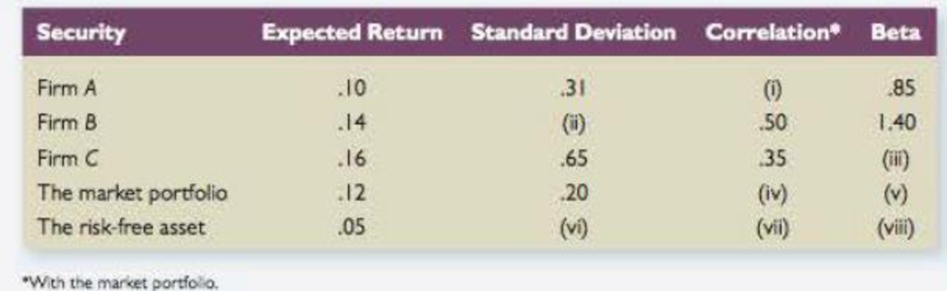
- a. Fill in the missing values in the table.
- b. Is the stock of Firm A correctly priced according to the
capital asset pricing model (CAPM)? What about the stock of Firm B? Finn C? If these securities are not correctly priced, what is your investment recommendation for someone with a well-diversified portfolio?
Expert Solution & Answer
Want to see the full answer?
Check out a sample textbook solution
Students have asked these similar questions
PART A,B and C are completed. need help in D and E. TIA
Unique vs. Market Risk. The figure below shows plots of monthly rates of return on three stocks versus the stock market index. The beta and standard deviation of each stock is given besides its plot.
A. Which stock is riskiest to a diversified investor?
B. Which stock is riskiest to an undiversified investor who puts all her funds in one of these stocks?
C. Consider a portfolio with equal investments in each stock. What would this portfolio’s beta have been?
D. Consider a well-diversified portfolio made up of stocks with the same beta as Exxon. What are the beta and standard deviation of this portfolio’s return? The standard deviation of the market portfolio’s return is 20 percent.
E. What is the expected rate of return on each stock? Use the capital asset pricing model with a market risk premium of 8 percent. The risk-free rate of interest is 4 percent.
QUESTION ONE
Why do most investors hold diversified portfolios? and What is covariance, and why is it important in portfolio theory?
Why do most assets of the same type show positive covariances of returns with each other? Would you expect positive covariances of returns between differenttypes of assets such as returns on Treasury bills, General Electric common stock, and commercial real estate? Why or why not?
What is the relationship between covariance and the correlation coefficient? and Explain the shape of the efficient frontier.
Draw a properly labeled graph of the Markowitz efficient frontier. Describe the efficient frontier in exact terms. Discuss the concept of dominant portfolios, and show an example of one on your graph.
Assume you want to run a computer program to derive the efficient frontier for your feasible set of stocks. What information must you input to the program?
(Expected rate of return and risk) Syntex, Inc. is considering an investment in one of two common stocks. Given the information that follows, which investment is better, based on the risk (as measured by the standard deviation) and return?
Common Stock A Common Stock B Probability Return Probability Return0.20 10% 0.15 -4%
0.60 16% 0.35 7%0.20 21% 0.35 13% 0.15 20%
a) Syntex, Inc. is considering an investment in one of two common stocks. Given the information that follows, what is the expected rate of return for stock A? What is the standard deviation?
b. Syntex, Inc. is considering an investment in one of two common stocks. Given the information that follows, what is the expected rate of return for stock B? What is the standard deviation?
c. Based on the risk (as measured by the standard deviation) and return of each stock, which…
Chapter 11 Solutions
Loose Leaf for Corporate Finance (Mcgraw-hill/Irwin Series in Finance, Insurance, and Real Estate)
Ch. 11 - Diversifiable and Nondiversifiable Risks In broad...Ch. 11 - Systematic versus Unsystematic Risk Classify the...Ch. 11 - Expected Portfolio Returns If a portfolio has a...Ch. 11 - Diversification True or false: The most important...Ch. 11 - Portfolio Risk If a portfolio has a positive...Ch. 11 - Beta and CAPM Is it possible that a risky asset...Ch. 11 - Covariance Briefly explain why the covariance of a...Ch. 11 - Prob. 8CQCh. 11 - Prob. 9CQCh. 11 - Prob. 10CQ
Ch. 11 - Determining Portfolio Weights What are the...Ch. 11 - Portfolio Expected Return You own a portfolio that...Ch. 11 - Portfolio Expected Return You own a portfolio that...Ch. 11 - Portfolio Expected Return You have 10,000 to...Ch. 11 - Prob. 5QPCh. 11 - Calculating Returns and Standard Deviations Based...Ch. 11 - Calculating Expected Returns A portfolio is...Ch. 11 - Returns and Standard Deviations Consider the...Ch. 11 - Returns and Standard Deviations Consider the...Ch. 11 - Calculating Portfolio Betas You own a stock...Ch. 11 - Calculating Portfolio Betas You own a portfolio...Ch. 11 - Using CAPM A stock has a beta of 1.15, the...Ch. 11 - Using CAPM A stock has an expected return of 13.4...Ch. 11 - Using CAPM A stock has an expected return of 13.4...Ch. 11 - Using CAPM A stock has an expected return of 11.2...Ch. 11 - Prob. 16QPCh. 11 - Prob. 17QPCh. 11 - Reward-to-Risk Ratios Stock Y has a beta of 1.20...Ch. 11 - Prob. 19QPCh. 11 - Portfolio Returns Using information from the...Ch. 11 - Prob. 21QPCh. 11 - Portfolio Returns and Deviations Consider the...Ch. 11 - Analyzing a Portfolio You want to create a...Ch. 11 - Prob. 24QPCh. 11 - Prob. 25QPCh. 11 - Prob. 26QPCh. 11 - Prob. 27QPCh. 11 - Prob. 28QPCh. 11 - Correlation and Beta You have been provided the...Ch. 11 - CML The market portfolio has an expected return of...Ch. 11 - Beta and CAPM A portfolio that combines the...Ch. 11 - Beta and CAPM Suppose the risk-free rate is 4.7...Ch. 11 - Systematic versus Unsystematic Risk Consider the...Ch. 11 - SML Suppose you observe the following situation:...Ch. 11 - Prob. 35QPCh. 11 - Prob. 36QPCh. 11 - Prob. 37QPCh. 11 - Minimum Variance Portfolio Assume Stocks A and 8...Ch. 11 - Prob. 1MCCh. 11 - Prob. 2MC
Knowledge Booster


Learn more about
Need a deep-dive on the concept behind this application? Look no further. Learn more about this topic, finance and related others by exploring similar questions and additional content below.Similar questions
- Calculate the correlation coefficient between Blandy and the market. Use this and the previously calculated (or given) standard deviations of Blandy and the market to estimate Blandy’s beta. Does Blandy contribute more or less risk to a well-diversified portfolio than does the average stock? Use the SML to estimate Blandy’s required return.arrow_forwardMarket equity beta measures the covariability of a firms returns with all shares traded on the market (in excess of the risk-free interest rate). We refer to the degree of covariability as systematic risk. The market prices securities so that the expected returns should compensate the investor for the systematic risk of a particular stock. Stocks carrying a market equity beta of 1.20 should generate a higher return than stocks carrying a market equity beta of 0.90. Nonsystematic risk is any source of risk that does not affect the covariability of a firms returns with the market. Some writers refer to nonsystematic risk as firm-specific risk. Why is the characterization of nonsystematic risk as firm-specific risk a misnomer?arrow_forwardYou have been hired at the investment firm of Bowers & Noon. One of its clients doesn’t understand the value of diversification or why stocks with the biggest standard deviations don’t always have the highest expected returns. Your assignment is to address the client’s concerns by showing the client how to answer the following questions: Plot the attainable portfolios for a correlation of 0.35. Now plot the attainable portfolios for correlations of +1.0 and −1.0.arrow_forward
- What is a characteristic line? How is this line used to estimate a stocks beta coefficient? Write out and explain the formula that relates total risk, market risk, and diversifiable risk.arrow_forwardYou have been hired at the investment firm of Bowers & Noon. One of its clients doesn’t understand the value of diversification or why stocks with the biggest standard deviations don’t always have the highest expected returns. Your assignment is to address the client’s concerns by showing the client how to answer the following questions: Write out the equation for the Capital Market Line (CML), and draw it on the graph. Interpret the plotted CML. Now add a set of indifference curves and illustrate how an investor’s optimal portfolio is some combination of the risky portfolio and the risk-free asset. What is the composition of the risky portfolio?arrow_forwardUsing Past Information to Estimate Required Returns Use online resources to work on this chapter's questions. Please note that website information changes over time, and these changes may limit your ability to answer some of these questions. Chapter 8 discussed the basic trade-off between risk and return. In the capital asset pricing model (CAPM) discussion, beta was identified as the correct measure of risk for diversified shareholders. Recall that beta measures the extent to which the returns of a given stock move with the stock market. When using the CAPM to estimate required returns, we would like to know how the stock will move with the market in the future, but because we dont have a crystal ball, we generally use historical data to estimate this relationship with beta. As mentioned in Web Appendix 8A, beta can be estimated by regressing the individual stock's returns against the returns of the overall market. As an alternative to running our own regressions, we can rely on reported betas from a variety of sources. These published sources make it easy for us to readily obtain beta estimates for most large publicly traded corporations. However, a word of caution is in order. Beta estimates can often be quite sensitive to the time period in which the data are estimated, the market index used, and the frequency of the data used. Therefore, it is not uncommon to find a wide range of beta estimates among the various Internet websites. 4. Select one of the four stocks listed in question 3 by entering the company's ticker symbol on the financial website you have chosen. On the screen you should see the interactive chart. Select the six-month time period and compare the stock's performance to the SP 500's performance on the graph by adding the SP 500 to the interactive chart. Has the stock outperformed or underperformed the overall market during this time period?arrow_forward
- You have been hired at the investment firm of Bowers & Noon. One of its clients doesn’t understand the value of diversification or why stocks with the biggest standard deviations don’t always have the highest expected returns. Your assignment is to address the client’s concerns by showing the client how to answer the following questions: What is the Capital Asset Pricing Model (CAPM)? What are the assumptions that underlie the model? What is the Security Market Line (SML)?arrow_forwardYou have been hired at the investment firm of Bowers Noon. One of its clients doesnt understand the value of diversification or why stocks with the biggest standard deviations dont always have the highest expected returns. Your assignment is to address the clients concerns by showing the client how to answer the following questions: d. Construct a plausible graph that shows risk (as measured by portfolio standard deviation) on the x-axis and expected rate of return on the y-axis. Now add an illustrative feasible (or attainable) set of portfolios and show what portion of the feasible set is efficient. What makes a particular portfolio efficient? Dont worry about specific values when constructing the graphmerely illustrate how things look with reasonable data.arrow_forwardThe beta coefficient A stock’s contribution to the market risk of a well-diversified portfolio is called risk. It can be measured by a metric called the beta coefficient, which calculates the degree to which a stock moves with the movements in the market. Based on your understanding of the beta coefficient, indicate whether each statement in the following table is true or false: Statement True False Over time, a stock with a beta of 1.0 produces a return that goes up and down with a 1:1 relationship with the return on the market. Beta measures the volatility in stock movements relative to the market. A stock that is more volatile than the market will have a beta of less than 1.0.arrow_forward
arrow_back_ios
arrow_forward_ios
Recommended textbooks for you
 EBK CONTEMPORARY FINANCIAL MANAGEMENTFinanceISBN:9781337514835Author:MOYERPublisher:CENGAGE LEARNING - CONSIGNMENT
 Financial Reporting, Financial Statement Analysis...FinanceISBN:9781285190907Author:James M. Wahlen, Stephen P. Baginski, Mark BradshawPublisher:Cengage Learning
 Intermediate Financial Management (MindTap Course...FinanceISBN:9781337395083Author:Eugene F. Brigham, Phillip R. DavesPublisher:Cengage Learning
 Fundamentals of Financial Management (MindTap Cou...FinanceISBN:9781285867977Author:Eugene F. Brigham, Joel F. HoustonPublisher:Cengage Learning
 Fundamentals of Financial Management (MindTap Cou...FinanceISBN:9781337395250Author:Eugene F. Brigham, Joel F. HoustonPublisher:Cengage Learning
EBK CONTEMPORARY FINANCIAL MANAGEMENT
Finance
ISBN:9781337514835
Author:MOYER
Publisher:CENGAGE LEARNING - CONSIGNMENT
Financial Reporting, Financial Statement Analysis...
Finance
ISBN:9781285190907
Author:James M. Wahlen, Stephen P. Baginski, Mark Bradshaw
Publisher:Cengage Learning
Intermediate Financial Management (MindTap Course...
Finance
ISBN:9781337395083
Author:Eugene F. Brigham, Phillip R. Daves
Publisher:Cengage Learning
Fundamentals of Financial Management (MindTap Cou...
Finance
ISBN:9781285867977
Author:Eugene F. Brigham, Joel F. Houston
Publisher:Cengage Learning
Fundamentals of Financial Management (MindTap Cou...
Finance
ISBN:9781337395250
Author:Eugene F. Brigham, Joel F. Houston
Publisher:Cengage Learning
Portfolio return, variance, standard deviation; Author: MyFinanceTeacher;https://www.youtube.com/watch?v=RWT0kx36vZE;License: Standard YouTube License, CC-BY