
Videos
a.
To determine: The Expected Return and Standard Deviation for each Security.
Introduction: Expected Return is a process of estimating the
a.
Answer to Problem 35QP
The Expected Return is 12.50%, Variance is 0.002125 and Standard Deviation for Asset 1 is 4.61%. The Expected Return is 12.50%, Variance is 0.002125 and Standard Deviation for Asset 2 is 4.61%. The Expected Return is 12.50%, Variance is 0.002125 and Standard Deviation for Asset 3 is 4.61%.
Explanation of Solution
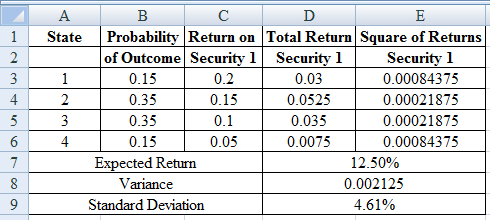
Determine the Expected Return, Variance and Standard Deviation for Asset 1
Using excel spreadsheet we calculate the expected return, variance and standard deviation as,
Excel Spreadsheet:
Excel Workings:
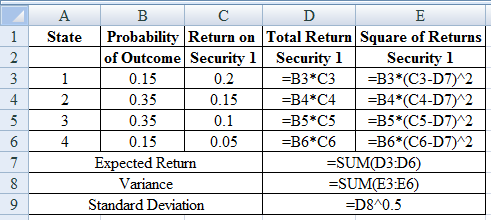
Therefore the Expected Return is 12.50%, Variance is 0.002125 and Standard Deviation for Asset 1 is 4.61%
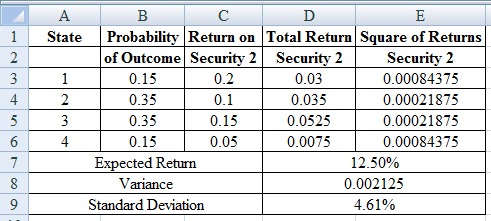
Determine the Expected Return, Variance and Standard Deviation for Asset 2
Using excel spreadsheet we calculate the expected return, variance and standard deviation as,
Excel Spreadsheet:
Excel Workings:
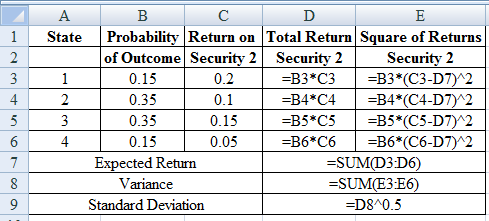
Therefore the Expected Return is 12.50%, Variance is 0.002125 and Standard Deviation for Asset 2 is 4.61%
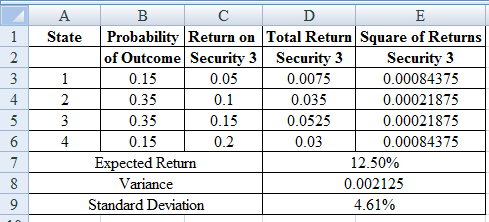
Determine the Expected Return, Variance and Standard Deviation for Asset 3
Using excel spreadsheet we calculate the expected return, variance and standard deviation as,
Excel Spreadsheet:
Excel Workings:
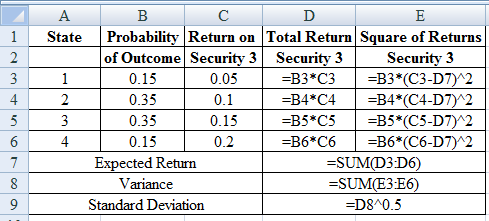
Therefore the Expected Return is 12.50%, Variance is 0.002125 and Standard Deviation for Asset 3 is 4.61%
b.
To determine: The Covariance and Correlation for each pair of security.
b.
Answer to Problem 35QP
Solution: The Covariance is 0.00125 and Correlation is 0.5882 for Security 1 and 2. The Covariance is -0.002125 and Correlation is -1 for Security 1 and 3. The Covariance is -0.00125 and Correlation is -0.5882 for Security 2 and 3.
Explanation of Solution
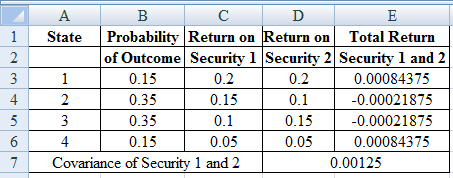
Determine the Covariance for Security 1 and 2
Using excel we find the covariance and correlation for security 1 and 2 as,
Excel Spreadsheet:
Excel Workings:
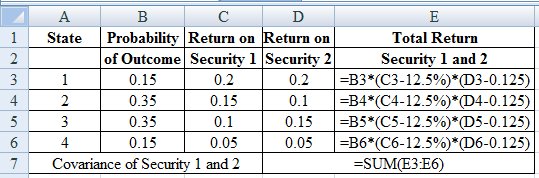
Therefore the Covariance for Security 1 and 2 is 0.00125
Determine the Correlation for Security 1 and 2
Therefore the Correlation for Security 1 and 2 is 0.5882
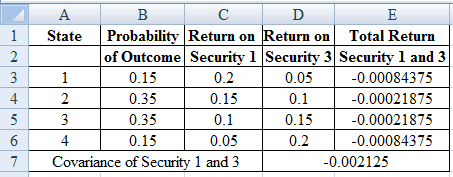
Determine the Covariance for Security 1 and 3
Using excel we find the covariance and correlation for security 1 and 3 as,
Excel Spreadsheet:
Excel Workings:
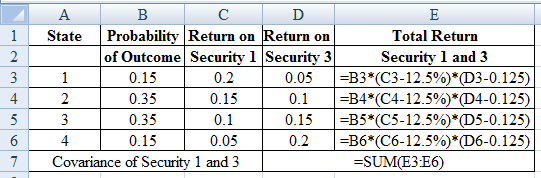
Therefore the Covariance for Security 1 and 3 is -0.00125
Determine the Correlation for Security 1 and 3
Therefore the Correlation for Security 1 and 3 is -1
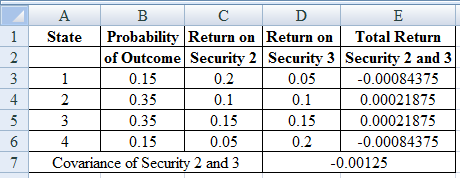
Determine the Covariance for Security 2 and 3
Using excel we find the covariance and correlation for security 2 and 3 as,
Excel Spreadsheet:
Excel Workings:
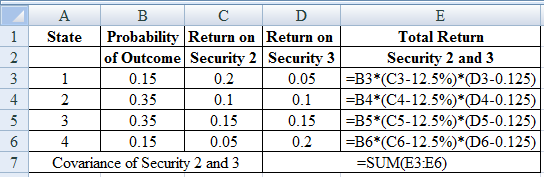
Therefore the Covariance for Security 2 and 3 is -0.00125
Determine the Correlation for Security 2 and 3
Therefore the Correlation for Security 2 and 3 is -0.5882.
c.
To determine: The Expected Return and Standard Deviation of Portfolio of Security 1 and Security 2.
c.
Answer to Problem 35QP
Solution: The Expected Return is 12.50% and Standard Deviation of Portfolio of Security 1 and Security 2 is 4.11%.
Explanation of Solution
Determine the Expected Return on Portfolio of Security 1 and 2
Therefore the Expected Return on Portfolio of Security 1 and 2 is 12.50%
Determine the Variance on Portfolio of Security 1 and 2
Therefore the Variance on Portfolio of Security 1 and 2 is 0.001687
Determine the Standard Deviation on Portfolio of Security 1 and 2
Therefore the Standard Deviation on Portfolio of Security 1 and 2 is 4.11%.
d.
To determine: The Expected Return and Standard Deviation of Portfolio of Security 1 and Security 3.
d.
Answer to Problem 35QP
The Expected Return is 12.50% and Standard Deviation of Portfolio of Security 1 and Security 3 is 0%.
Explanation of Solution
Determine the Expected Return on Portfolio of Security 1 and 3
Therefore the Expected Return on Portfolio of Security 1 and 3 is 12.50%
Determine the Variance on Portfolio of Security 1 and 3
Therefore the Variance on Portfolio of Security 1 and 3 is 0
Determine the Standard Deviation on Portfolio of Security 1 and 3
Therefore the Standard Deviation is 0%.
e.
To determine: The Expected Return and Standard Deviation of Portfolio of Security 2 and Security 3.
e.
Answer to Problem 35QP
The Expected Return is 12.50% and Standard Deviation of Portfolio of Security 2 and Security 3 is 2.09%.
Explanation of Solution
Determine the Expected Return on Portfolio of Security 2 and 3
Therefore the Expected Return on Portfolio of Security 2 and 3 is 12.50%
Determine the Variance on Portfolio of Security 2 and 3
Therefore the Variance on Portfolio of Security 2 and 3 is 0.000438
Determine the Standard Deviation on Portfolio of Security 2 and 3 is 0
Therefore the Standard Deviation is 2.09%.
f.
To determine: The Results of parts (a), (c), (d) and (e).
f.
Explanation of Solution
- The correlation between's the profits on two securities is below 1, there is an advantage to diversification.
- A portfolio that comprise of negatively correlated portfolios can accomplish higher risk diminishment than a positively correlated portfolio and the expected return of the stock being even.
- Applying appropriate weights on perfectly negatively correlated securities can lessen portfolio change to 0.
Want to see more full solutions like this?
Chapter 11 Solutions
Loose Leaf for Corporate Finance (Mcgraw-hill/Irwin Series in Finance, Insurance, and Real Estate)


- Two-Asset Portfolio Stock A has an expected return of 12% and a standard deviation of 40%. Stock B has an expected return of 18% and a standard deviation of 60%. The correlation coefficient between Stocks A and B is 0.2. What are the expected return and standard deviation of a portfolio invested 30% in Stock A and 70% in Stock B?arrow_forwardWhat is a characteristic line? How is this line used to estimate a stocks beta coefficient? Write out and explain the formula that relates total risk, market risk, and diversifiable risk.arrow_forwardMarket equity beta measures the covariability of a firms returns with all shares traded on the market (in excess of the risk-free interest rate). We refer to the degree of covariability as systematic risk. The market prices securities so that the expected returns should compensate the investor for the systematic risk of a particular stock. Stocks carrying a market equity beta of 1.20 should generate a higher return than stocks carrying a market equity beta of 0.90. Nonsystematic risk is any source of risk that does not affect the covariability of a firms returns with the market. Some writers refer to nonsystematic risk as firm-specific risk. Why is the characterization of nonsystematic risk as firm-specific risk a misnomer?arrow_forward

 Intermediate Financial Management (MindTap Course...FinanceISBN:9781337395083Author:Eugene F. Brigham, Phillip R. DavesPublisher:Cengage Learning
 EBK CONTEMPORARY FINANCIAL MANAGEMENTFinanceISBN:9781337514835Author:MOYERPublisher:CENGAGE LEARNING - CONSIGNMENT
 Financial Reporting, Financial Statement Analysis...FinanceISBN:9781285190907Author:James M. Wahlen, Stephen P. Baginski, Mark BradshawPublisher:Cengage Learning