Concept explainers
Videos
Which data set is best illustrated with a bar graph? Explain why you feel that way, then draw a bar graph representing the data.
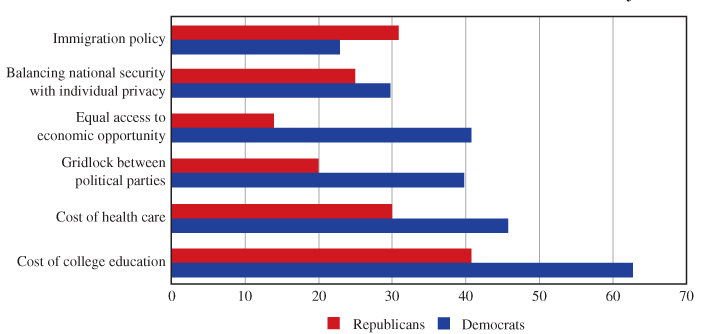
In May 2015, the Panetta Institute for Public Policy released the results of an extensive survey of college students. One of the questions was, “Do you think the following issues are or are not serious problems facing our country?” Results were divided by political party. Data for those self-reporting as either Democrat or Republican are illustrated by the following bar graph.
Which Issues Are Serious Problems for Our Countray?
Want to see the full answer?
Check out a sample textbook solution
Chapter 1 Solutions
Pathways To Math Literacy (looseleaf)
Additional Math Textbook Solutions
Differential Equations: An Introduction to Modern Methods and Applications
Calculus Volume 2
Thinking Mathematically (6th Edition)
Introductory Mathematics for Engineering Applications
MATH IN OUR WORLD (LOOSELEAF)-W/ACCESS
Mathematics for Elementary Teachers with Activities (5th Edition)


 Glencoe Algebra 1, Student Edition, 9780079039897...AlgebraISBN:9780079039897Author:CarterPublisher:McGraw Hill
 Big Ideas Math A Bridge To Success Algebra 1: Stu...AlgebraISBN:9781680331141Author:HOUGHTON MIFFLIN HARCOURTPublisher:Houghton Mifflin Harcourt
 Holt Mcdougal Larson Pre-algebra: Student Edition...AlgebraISBN:9780547587776Author:HOLT MCDOUGALPublisher:HOLT MCDOUGAL