Concept explainers
Videos
Use the graph to write a verbal description of trends in the unemployment rate, then explain why the graph makes it easier than the table did.
Without the numbers running along the bottom side of the graph and down the left side, we wouldn’t be able to understand any of the information the graph provides. Those numbers provide the scale for the graph, and they’re ALWAYS crucial in drawing a graph. Each of the number lines that we write the scale on is called an axis (the plural of this word is axes).
Based on figures from January to October of 2016, the average unemployment rate for that year was expected to be about 4.9%. We can add that piece of information to the graph by finding 2016 on the horizontal axis and 4.9 on the vertical axis, then drawing imaginary lines up from 2016 and right from 4.9 until the lines meet: That’s where we put the point corresponding to 2016 and 4.9%.
Unemployment Rate in the United States
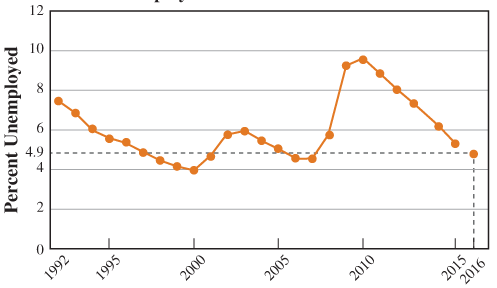
Year
Notice that when we found the location to indicate that the unemployment rate was 4.9% in 2016, the imaginary lines we drew formed a rectangle with the two axes. That’s why we call this system of graphing a rectangular
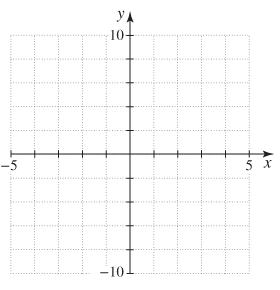
Since we didn’t need to worry about negative years or negative unemployment rates, the graph we drew earlier only showed positive values along each axis. But there are plenty of examples of data where negative values make perfect sense, so a rectangular coordinate system is often set up like this:
The process of locating information on a rectangular coordinate system, like the 4.9% unemployment rate in 2016, is called plotting points. We identify locations by writing the two coordinates together inside parentheses, like this: (2016, 4.9).

Trending nowThis is a popular solution!

Chapter 1 Solutions
Pathways To Math Literacy (looseleaf)
Additional Math Textbook Solutions
Calculus Volume 2
Algebra and Trigonometry: Graphs and Models (6th Edition)
Differential Equations: An Introduction to Modern Methods and Applications
Mathematics with Applications In the Management, Natural and Social Sciences (11th Edition)
Finite Mathematics & Its Applications (12th Edition)
The Heart of Mathematics: An Invitation to Effective Thinking


 College AlgebraAlgebraISBN:9781305115545Author:James Stewart, Lothar Redlin, Saleem WatsonPublisher:Cengage Learning
 Glencoe Algebra 1, Student Edition, 9780079039897...AlgebraISBN:9780079039897Author:CarterPublisher:McGraw Hill
 Elementary AlgebraAlgebraISBN:9780998625713Author:Lynn Marecek, MaryAnne Anthony-SmithPublisher:OpenStax - Rice University
 Trigonometry (MindTap Course List)TrigonometryISBN:9781305652224Author:Charles P. McKeague, Mark D. TurnerPublisher:Cengage Learning
 Algebra: Structure And Method, Book 1AlgebraISBN:9780395977224Author:Richard G. Brown, Mary P. Dolciani, Robert H. Sorgenfrey, William L. ColePublisher:McDougal Littell
 Intermediate AlgebraAlgebraISBN:9781285195728Author:Jerome E. Kaufmann, Karen L. SchwittersPublisher:Cengage Learning