Videos
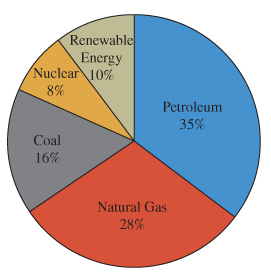
Questions 1-5 use the pie charts below. The first illustrates the percentage of energy consumption in the United States by energy source for 2014. The second illustrates the specific breakdown of different renewable energy sources.
U.S. Energy Consumption by Source
Breakdown of Renewable Energy Sources
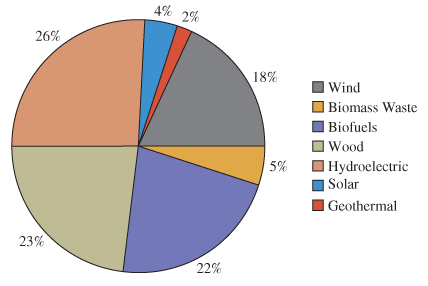
How many quadrillion BTU were generated using renewable energy sources?

Trending nowThis is a popular solution!

Chapter 1 Solutions
Pathways To Math Literacy (looseleaf)
Additional Math Textbook Solutions
A Problem Solving Approach To Mathematics For Elementary School Teachers (13th Edition)
Basic College Mathematics (12th Edition)
MATH IN OUR WORLD (LOOSELEAF)-W/ACCESS
Thinking Mathematically (6th Edition)
A Survey of Mathematics with Applications (10th Edition) - Standalone book
The Heart of Mathematics: An Invitation to Effective Thinking


 Trigonometry (MindTap Course List)TrigonometryISBN:9781305652224Author:Charles P. McKeague, Mark D. TurnerPublisher:Cengage Learning
 Mathematics For Machine TechnologyAdvanced MathISBN:9781337798310Author:Peterson, John.Publisher:Cengage Learning,
 Algebra: Structure And Method, Book 1AlgebraISBN:9780395977224Author:Richard G. Brown, Mary P. Dolciani, Robert H. Sorgenfrey, William L. ColePublisher:McDougal Littell
 Algebra & Trigonometry with Analytic GeometryAlgebraISBN:9781133382119Author:SwokowskiPublisher:Cengage