
Videos
Systematic versus Unsystematic Risk. Consider the following information on Stocks I and II:
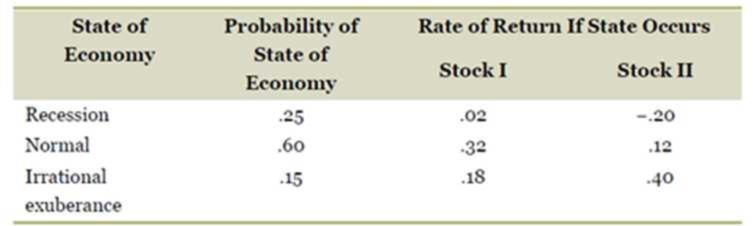
The market risk premium is 7 percent, and the risk-free rate is 4 percent. Which stock has the most systematic risk? Which one has the most unsystematic risk? Which stock is “riskier”? Explain
To determine: The stock that has the most systematic risk and the most unsystematic risk.
Introduction:
Systematic risk refers to the market-specific risk that affects all the stocks in the market.
Unsystematic risk refers to the company-specific risk that affects only the individual company.
Explanation of Solution
Given information:
The probability of having a recession, normal economy, and irrational exuberance is 0.25, 0.60, and 0.15 respectively. Stock I will yield 2%, 32%, and 18% when there is a recession, normal economy, and irrational exuberance respectively.
Stock II will yield −20%, 12%, and 40% when there is a recession, normal economy, and irrational exuberance respectively. The market risk premium is 7% and the risk-free rate is 4%.
The formula to calculate the expected return on the stock:
The formula to calculate the beta of the stock:
Where,
E(Ri) refers to the expected return on a risky asset
Rf refers to the risk-free rate
E(RM) refers to the expected return on the market portfolio
βi refers to the beta coefficient of the risky asset relative to the market portfolio
The formula to calculate the standard deviation:
Compute the expected return on Stock I:
R1 is the returns during the recession. The probability of having a recession is P1. Similarly, R2 is the returns in a normal economy. The probability of having a normal is P2. R3 is the returns in irrational exuberance. The probability of having an irrational exuberance is P3.
Hence, the expected return on Stock I is 0.2240 or 22.40 percent.
Compute the beta of Stock I:
Hence, the beta of Stock I is 2.63.
Compute the standard deviation of Stock I:
R1 is the returns during the recession. The probability of having a recession is P1. Similarly, R2 is the returns in a normal economy. The probability of having a normal is P2. R3 is the returns in irrational exuberance. The probability of having an irrational exuberance is P3.
Hence, the standard deviation of Stock I is 0.1274 or 12.74%.
Compute the expected return on Stock II:
R1 is the returns during the recession. The probability of having a recession is P1. Similarly, R2 is the returns in a normal economy. The probability of having a normal is P2. R3 is the returns in irrational exuberance. The probability of having an irrational exuberance is P3.
Hence, the expected return on Stock II is 0.0820 or 8.20 percent.
Compute the beta of Stock II:
Hence, the beta of Stock II is 0.6.
Compute the standard deviation of Stock II:
R1 is the returns during the recession. The probability of having a recession is P1. Similarly, R2 is the returns in a normal economy. The probability of having a normal is P2. R3 is the returns in irrational exuberance. The probability of having an irrational exuberance is P3.
Hence, the standard deviation of Stock II is 0.1895 or 18.95%.
Interpretation:
The beta refers to the systematic risk of the stock. Stock I has higher beta than Stock II. Hence, the systematic risk of Stock I is higher.
The standard deviation indicates the total risk of the stock. The standard deviation is high for Stock II despite having a low beta. Hence, a major portion of the standard deviation of Stock II is the unsystematic risk. Therefore, Stock II has higher unsystematic risk than Stock I.
To discuss: The riskier Stock among Stock I and Stock II.
Introduction:
Risk refers to the movement or fluctuation in the value of an investment. The movement can be positive or negative. A positive fluctuation in the price benefits the investor. The investor will lose money if the price movement is negative.
Explanation of Solution
The formation of a portfolio helps in diversifying the unsystematic risk. Although, the Stock II has a higher unsystematic risk, it can be diversified completely. However, the beta cannot be eliminated. Hence, the Stock I is riskier than Stock II.
Want to see more full solutions like this?
Chapter 11 Solutions
Loose Leaf for Essentials of Corporate Finance


- What is a characteristic line? How is this line used to estimate a stocks beta coefficient? Write out and explain the formula that relates total risk, market risk, and diversifiable risk.arrow_forwardMarket equity beta measures the covariability of a firms returns with all shares traded on the market (in excess of the risk-free interest rate). We refer to the degree of covariability as systematic risk. The market prices securities so that the expected returns should compensate the investor for the systematic risk of a particular stock. Stocks carrying a market equity beta of 1.20 should generate a higher return than stocks carrying a market equity beta of 0.90. Nonsystematic risk is any source of risk that does not affect the covariability of a firms returns with the market. Some writers refer to nonsystematic risk as firm-specific risk. Why is the characterization of nonsystematic risk as firm-specific risk a misnomer?arrow_forwardYou have observed the following returns over time: Assume that the risk-free rate is 6% and the market risk premium is 5%. What are the betas of Stocks X and Y? What are the required rates of return on Stocks X and Y? What is the required rate of return on a portfolio consisting of 80% of Stock X and 20% of Stock Y?arrow_forward
- When working with the CAPM, which of the following factors can be determined with the most precision? a. The most appropriate risk-free rate, rRF. b. The market risk premium (RPM). c. The beta coefficient, bi, of a relatively safe stock. d. The expected rate of return on the market, rM. e. The beta coefficient of "the market," which is the same as the beta of an average stock.arrow_forwardConsider the following information about Stocks X and Y: State of Economy Probability of State Stock X Returns Stock Y Returns Recession 0.15 0.11 -0.25 Steady 0.55 0.18 0.11 Boom 0.30 0.08 0.31 The market risk premium is 7.5 percent, and the risk-free rate is 4 percent. Which stock has the most systematic risk? Which one has the most unsystematic risk? Which stock is “riskier”? Explain.arrow_forwardFrom the following information, calculate covariance between stocks A and B and expected return and risk of a portfolio in which A and B are equally weighted.Which stock would be best recommend if investment in individual stock is to be made? Justify the answer using numerical calculations. Stock A Stock B Expected return 24% 35% Standard deviation 12% 18% Coefficient of correlation 0.65arrow_forward
 Intermediate Financial Management (MindTap Course...FinanceISBN:9781337395083Author:Eugene F. Brigham, Phillip R. DavesPublisher:Cengage Learning

 EBK CONTEMPORARY FINANCIAL MANAGEMENTFinanceISBN:9781337514835Author:MOYERPublisher:CENGAGE LEARNING - CONSIGNMENT
 Financial Reporting, Financial Statement Analysis...FinanceISBN:9781285190907Author:James M. Wahlen, Stephen P. Baginski, Mark BradshawPublisher:Cengage Learning