
Concept explainers
Videos
Dr. Penelope Nicholls is interested in exploring a possible connection between high plasma homocysteine (a toxic amino acid created by the body as it metabolizes protein) levels and cardiac hypertrophy (enlargement of the heart) in humans. Because there are many complex relationships among human characteristics, it will be difficult to answer her research question due to a significant risk that confounding factors will cloud her inferences. She wants to be sure that any differences in cardiac hypertrophy are due to high plasma homocysteine levels and not to other factors. Consequently, she needs to design her experiment carefully so that she controls lurking variables to the extent possible. Therefore, she decides to design a two-sample experiment with independent sampling: one group will be the experimental group, the other a control group. Knowing that many factors can affect the degree of cardiac hypertrophy (the response variable), Dr. Nicholls controls these factors by randomly assigning the experimental units to the experimental or control group. She hopes the randomization will result in both groups having similar characteristics.
In her preliminary literature review, Dr. Nicholls uncovered an article in which the authors hypothesized that there might be a relationship between high plasma homocysteine levels in patients with end-stage renal disease (ESRD) and cardiac hypertrophy. She has asked you, as her assistant, to review this article.
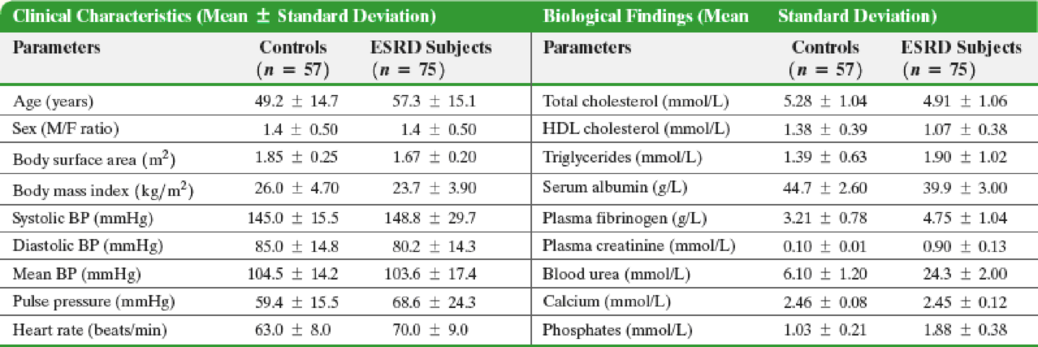
Upon reading the article, you discover that the authors used a nonrandom process to select a control group and an ESRD group. The researchers enlisted 75 stable ESRD patients into their study, all on hemodialysis for between 6 and 312 months. The control group subjects were chosen so as to eliminate any intergroup differences in terms of mean blood pressure (BP) and gender. In an effort to minimize situational contaminants, all physical and biochemical measurements were made after an overnight fast. The results for the control and ESRD groups are reproduced in the tables below.
3. Detail any assumptions and the rationale behind making them that you made while carrying out your analysis. Is there any additional information that you would like to have? Explain. Are there any additional statistical procedures that you think might be useful for analyzing these data? Explain.
Want to see the full answer?
Check out a sample textbook solution
Chapter 11 Solutions
Fundamentals of Statistics (5th Edition)


- After examining these data for all the jurisdictions, someone notes that certain areas have an unusually high “percent of 18-64 yr-olds with no high school diploma.” Based on this finding, this individual concludes that the high percentages are due to the rising population of immigrants in those areas. Further, the individual argues that any estimates of the associated “percent of low-income working families” in those areas should be recalculated after removing this sub-population from the data set, as they are causing the area to “look bad”. In addition to thinking critically, use the key rules about linear regression and extrapolation to write a statistically appropriate and socially responsible response to the individual’s conclusion and argument.arrow_forwardIf two variables are associated, does that mean they are necessarily causally related and What info is additionally needed?arrow_forwardwhat would a positive association mean betwwen these two variables? briefly explain why a poaitive relationship might make sense in.this context.arrow_forward
 Glencoe Algebra 1, Student Edition, 9780079039897...AlgebraISBN:9780079039897Author:CarterPublisher:McGraw Hill