
Videos
a.
Check whether there is evidence that there is a difference in the mean selling price of homes with a pool and without a pool.
a.
Answer to Problem 47DE
The conclusion is that there is evidence of a difference in the mean selling prices of homes with a pool and without a pool.
Explanation of Solution
In this context, let
The hypotheses are given below:
Null hypothesis:
Alternative hypothesis:
Significance level,
It is given that the significance level,
Degrees of freedom:
The degrees of freedom is as follows:
Step-by-step procedure to obtain the critical values using MINITAB software:
- Choose Graph > Probability Distribution Plot choose View Probability > OK.
- From Distribution, choose ‘t’ distribution.
- In Degrees of freedom, enter 103.
- Click the Shaded Area tab.
- Choose Probability and Both Tails for the region of the curve to shade.
- Enter the Probability as 0.05.
- Click OK.
Output obtained using MINITAB software is given below:
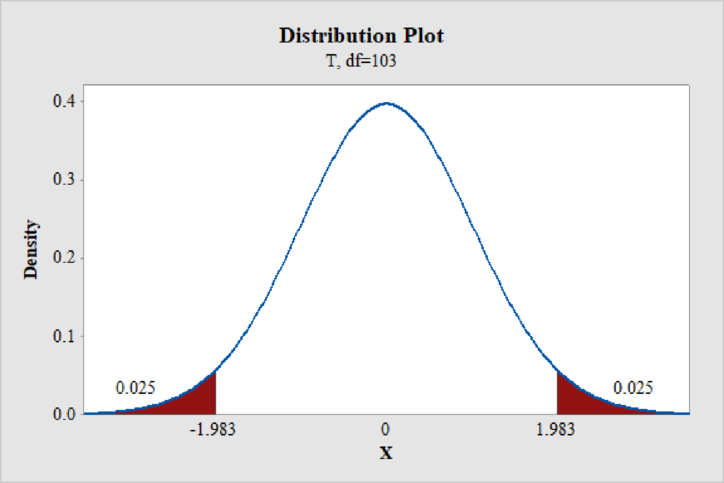
From the MINITAB output, the critical values are
The decision rule is as follows:
If
If
If
Test statistic:
Step-by-step procedure to obtain the P-value and test statistic using MINITAB software:
- Choose Stat > Basic Statistics > 2 sample t.
- Choose Each sample in its own column.
- In Sample 1, enter the column of Without pool.
- In Sample 2, enter the column of With pool.
- Choose Assume equal variance.
- Choose Options.
- In Confidence level, enter 95.
- In Alternative, select not equal.
- Click OK in all the dialogue boxes.
Output obtained using MINITAB software is given below:
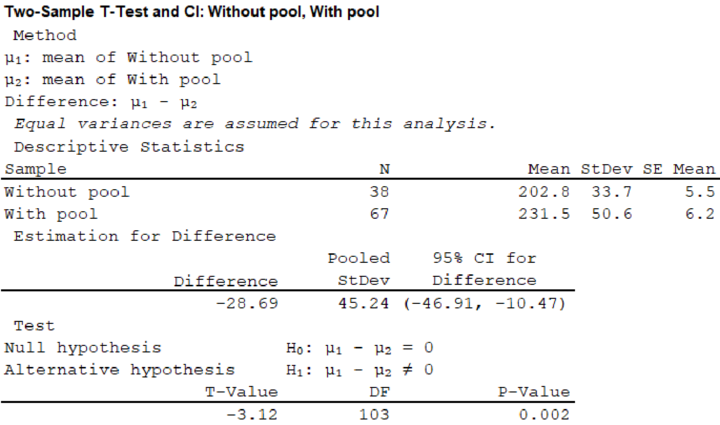
From the given MINITAB output, the value of the test statistic is –3.12.
Decision:
The critical values are ±1.983.
The value of test statistic is –3.12.
The value of test statistic does not lie between the critical values.
That is,
From the decision rule, reject the null hypothesis.
Therefore, there is evidence of a difference in the mean selling prices of homes with a pool and without a pool.
b.
Check whether there is evidence of a difference in the mean selling prices of homes with an attached garage and without an attached garage.
b.
Answer to Problem 47DE
The conclusion is that there is evidence of difference in the mean selling prices of homes with an attached garage and homes without an attached garage.
Explanation of Solution
In this context,
The hypotheses are given below:
Null hypothesis:
Alternative hypothesis:
Significance level,
It is given that the significance level,
Degrees of freedom:
The degrees of freedom is as follows:
From Part a, the critical values are
Test statistic:
Step-by-step procedure to obtain the P-value and test statistic using MINITAB software:
- Choose Stat > Basic Statistics > 2 sample t.
- Choose Samples in different columns.
- In Sample 1, enter the column of Without garage.
- In Sample 2, enter the column of With garage.
- Choose Assume equal variance.
- Choose Options.
- In Confidence level, enter 95.
- In Alternative, select not equal.
- Click OK in all the dialogue boxes.
Output obtained using MINITAB software is given below:
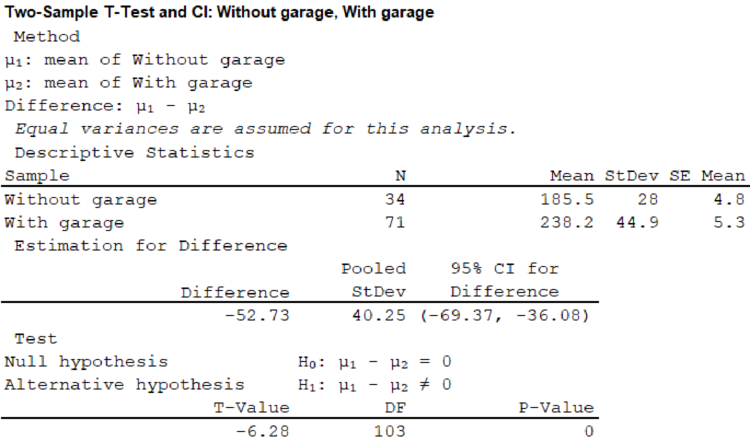
From the given MINITAB output, the value of the test statistic is –6.28.
Decision:
The critical values are ±1.983.
The value of test statistic is –6.28.
The value of test statistic is less than the critical value –1.983.
That is,
From the decision rule, reject the null hypothesis.
Therefore, there is evidence of difference in the mean selling prices of homes with an attached garage and without an attached garage.
c.
Check whether there is evidence of a difference in the mean selling price of homes in Township1 and Township 2.
c.
Answer to Problem 47DE
The conclusion is that there is no evidence of difference in the mean selling prices of homes in Township1 and Township 2.
Explanation of Solution
In this context,
The hypotheses are given below:
Null hypothesis:
Alternative hypothesis:
Significance level,
It is given that the significance level,
Degrees of freedom:
The degrees of freedom is as follows:
Step-by-step procedure to obtain the critical values using MINITAB software:
- Choose Graph > Probability Distribution Plot choose View Probability > OK.
- From Distribution, choose ‘t’ distribution.
- In Degrees of freedom, enter 32.
- Click the Shaded Area tab.
- Choose Probability and Both Tails for the region of the curve to shade.
- Enter the Probability as 0.05.
- Click OK.
Output obtained using MINITAB software is given below:
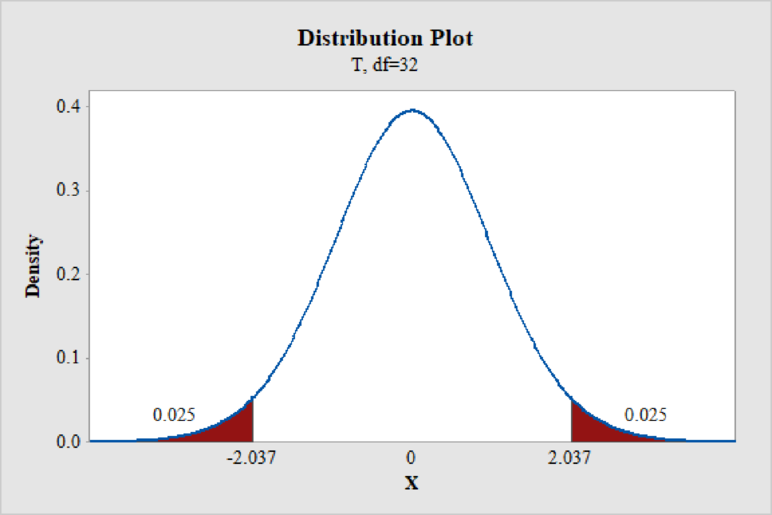
From the MINITAB output, the critical values are
The decision rule is as follows:
If
If
If
Test statistic:
Step-by-step procedure to obtain the P-value and test statistic using MINITAB software:
- Choose Stat > Basic Statistics > 2 sample t.
- Choose Samples in different columns.
- In Sample 1, enter the column of Town ship 1.
- In Sample 2, enter the column of Town ship 2.
- Choose Assume equal variance.
- Choose Options.
- In Confidence level, enter 95.
- In Alternative, select not equal.
- Click OK in all the dialogue boxes.
Output obtained using MINITAB software is given below:
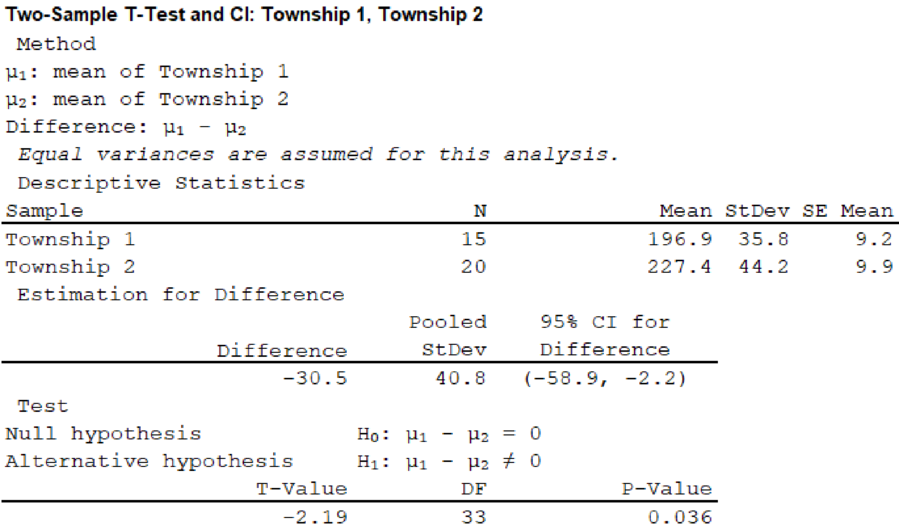
From the given MINITAB output, the value of the test statistic is –2.19.
Decision:
The critical values are ±2.037.
The value of test statistic is –2.19.
The value of test statistic does not lies between the critical values.
That is,
From the decision rule, reject the null hypothesis.
Therefore, there is evidence that the difference in the mean selling price of homes in Township1 and Township 2.
Want to see more full solutions like this?
Chapter 11 Solutions
Statistical Techniques in Business and Economics, 16th Edition


 Glencoe Algebra 1, Student Edition, 9780079039897...AlgebraISBN:9780079039897Author:CarterPublisher:McGraw Hill
 College Algebra (MindTap Course List)AlgebraISBN:9781305652231Author:R. David Gustafson, Jeff HughesPublisher:Cengage Learning