
Concept explainers
Videos
State whether it is reasonable to conclude that the mean weekly salary of nurses is higher.
Obtain the p-value.
Answer to Problem 12E
No, there is no enough evidence to conclude that the mean weekly salary of nurses is higher.
The p-value is 0.244.
Explanation of Solution
It is expected that the mean weekly salary of nurses is higher.
Therefore, the test hypotheses are given below:
Denote
Null hypothesis:
That is, the mean weekly salary of nurses are at most the mean weekly salary of school teachers.
Alternative hypothesis:
That is, the mean weekly salary of nurses is greater than the mean weekly salary of school teachers.
In this context, the level of significance is 0.05.
Necessary assumptions required for using the formula:
- The sampled populations are approximately
normally distributed. - The two samples are independent.
- The standard deviations for the two populations are equal.
In this context, the two populations are independent and distributed to normal. The population standard deviations are unknown.
Test statistic for two-sample test of means-unknown
Where,
Here,
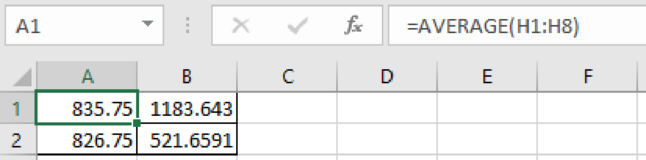
Excel procedure to find the mean and standard deviation for samples school teacher and nurses:
- Enter the data values in the column H and column I.
- Obtain the sample mean 1 (
- Press “Enter”.
- Obtain the sample variance 1
- Press “Enter”.
- Obtain the sample mean 2 (
- Press “Enter”.
- Obtain the sample variance 2
- Press “Enter”.
Output obtained using EXCEL is given below:
The pooled variance is obtained as given below:
Substitute
The test statistic is given below:
Substitute
Rejection region:
In context, the level of the test,
Here, the alternative is the right-tailed test. Hence, the rejection region will be
The critical value has to be obtained for
Critical value:
From the “Appendix B, Table B.5 Student’s t Distribution”, the critical value for 18 df for the level of significance 0.01 is 2.552.
Thus, the rejection region under the level of significance of 0.01 is
Decision rule:
- If
- Otherwise fail to reject the null hypothesis.
Conclusion:
Here, the test statistic, t, does not lie in the rejection region.
Therefore, by the decision rule, fail to reject the null hypothesis.
Therefore, there is no evidence to conclude that the mean weekly salary of nurses is higher.
p-value:
Step-by-step procedure to obtain the p-value using EXCEL:
- In a cell A1, enter the formula “=T.DIST.RT(0.7064,18)”.
- Press “Enter”.
Output obtained using EXCEL is given below:
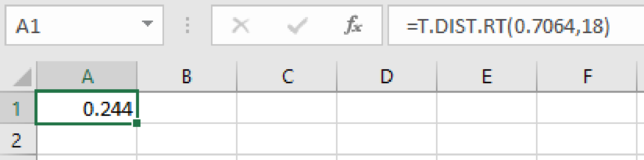
Thus, the p-value is 0.244.
Want to see more full solutions like this?
Chapter 11 Solutions
Statistical Techniques in Business and Economics, 16th Edition


 Glencoe Algebra 1, Student Edition, 9780079039897...AlgebraISBN:9780079039897Author:CarterPublisher:McGraw Hill
 College Algebra (MindTap Course List)AlgebraISBN:9781305652231Author:R. David Gustafson, Jeff HughesPublisher:Cengage Learning