Videos
Step Method with Three Service Departments
Model, Inc., produces model automobiles made from metal. It operates two production departments, Molding and Painting, and has three service departments, Administration, Accounting, and Maintenance. The accumulated costs in the three service departments were $250,000, $400,000, and $200,000, respectively. Management is concerned that the costs of its service departments are getting too high. In particular, managers would like to keep the costs of service departments under $3.50 per unit on average. You have been asked to allocate service department costs to the two production departments and compute the unit costs.
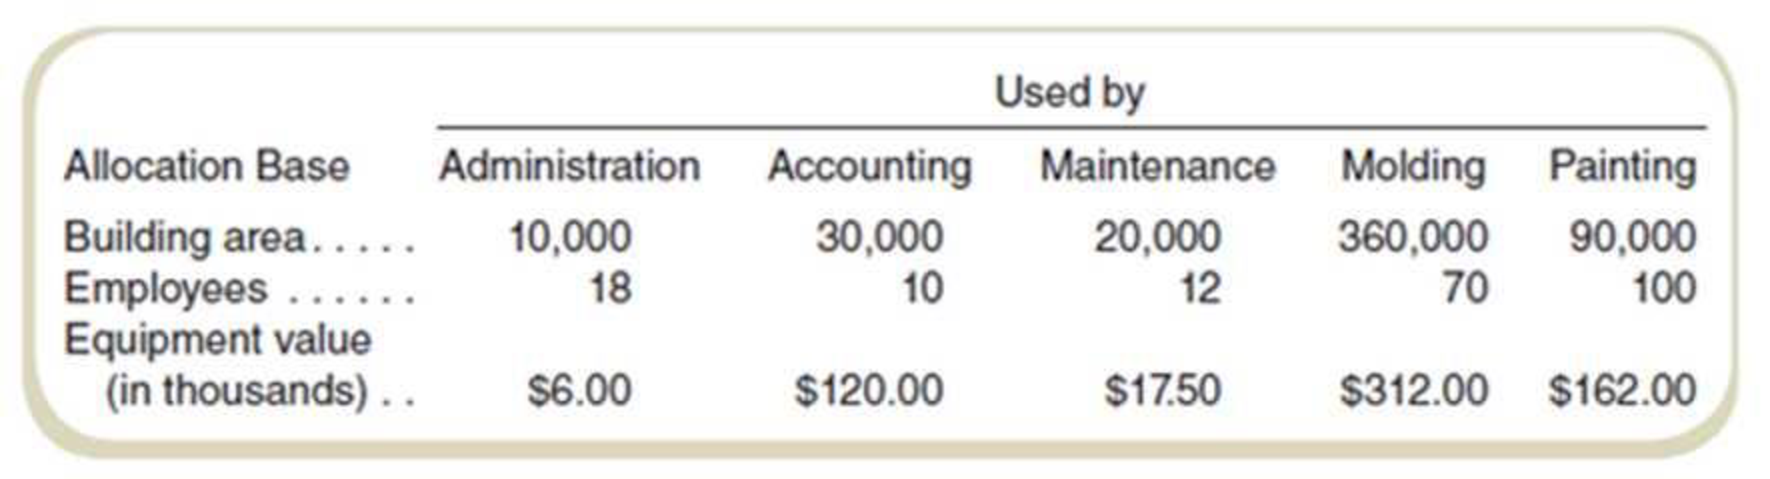
The company decided that Administration costs should be allocated on the basis of square footage used by each production and service department. Accounting costs are allocated on the basis of number of employees. Maintenance costs are allocated on the basis of the dollar value of the equipment in each department. The use of each base by all departments during the current period follows:
Direct costs of the Molding Department included $237,500 in direct materials, $337,500 in direct labor, and $112,500 in
Required
- a. Using the step method, determine the allocated costs and the total costs in each of the two producing departments. Ignore self-usage (for example, ignore work done by Administration for itself). Rank order the allocation as follows: (1) Maintenance, (2) Accounting, and (3) Administration.
- b. Assume that 100,000 units were processed through these two departments. What is the unit cost for the sum of direct materials, direct labor, and overhead (1) for Molding, (2) for Painting, and (3) in total?
- c. Compute the cost per unit for the service department costs allocated to the production departments. Did the company meet management’s standards of keeping service department costs below $3.50 per unit?
a.
Use the step method and determine the allocated costs and the total costs in each of the two producing departments. Make order the allocation as follows: (1) Maintenance, (2) Accounting, and (3) Administration.
Answer to Problem 48P
The cost allocation for molding department and painting department is $1,190,632 and $831,868.
Explanation of Solution
Step method:
Step method allows the allocation of the cost to the production department and service departments. Unlike the direct method, it also allocates the cost of the service to various service departments. Allocation of the cost starts from the department that has provided the highest proposition of service to the department that has provided the least service. Step method allows only one-way allocation of cost among service departments.
Calculate the allocation of costs:
| Department | |||||
| Amount | Maintenance | Accounting | Administration | Molding | Painting |
| Direct costs | $200,000 | $400,000 | $250,000 | $687,500 | $485,000 |
| Maintenance | $ (200,000) | $40,000 | $2,000 | $104,000 | $54,000 |
| Accounting | - | $ (440,000) | $42,128 | $163,830 | $234,042 |
| Administration | - | - | $(294,128) | $235,302 | $58,826 |
| Total cost | $0 | $0 | $0 | $1,190,632 | $831,868 |
Table: (1)
Thus, the cost allocation for the molding department and painting department is $1,190,632 and $831,868.
Working note 1:
Calculate the allocation of maintenance cost:
| Particulars |
Maintenance cost (a) |
Equipment value (b) |
Amount |
| Allocation to maintenance cost : | |||
| Accounting department | $200,000 | $120.0 | $40,000 |
| Administration department | $200,000 | $17.5 | $2,000 |
| Molding department | $200,000 | 312 | $104,000 |
| Painting department | $200,000 | 162 | $54,000 |
| Total | $611.50 |
Table: (2)
Working note 2:
Calculate the allocation of accounting department:
| Particulars |
Accounting cost (a) |
Number of employees (b) |
Amount |
| Allocation to accounting cost: | |||
| Administration department | $400,000 | 12 | $4,800,000 |
| Molding department | $400,000 | 70 | $28,000,000 |
| Painting department | $400,000 | 100 | $40,000,000 |
| Total | $182 | $0 |
Table: (3)
Working note 3:
Calculate the allocation of administration department:
| Particulars |
Administration cost (a) |
Building area (b) |
Amount |
| Allocation to accounting cost: | |||
| Molding department | $294,128 |
$360,000 | $235,302 |
| Painting department | $294,128 | $90,000 | $58,826 |
| Total | $450,000 |
Table: (4)
b.
Calculate the unit cost for the sum of direct materials, direct labor, and overhead cost (1) for Molding, (2) for Painting, and (3) in total.
Answer to Problem 48P
The unit cost of molding and painting is $11.91 and $8.31 respectively.
Explanation of Solution
Joint cost allocation:
Joint cost is the cost that occurs for two or more products of a business. When two or more products have the same production process then they share some common cost, that common cost is known as the joint cost of the production.
Calculate the unit cost for molding:
Calculate the unit cost for painting:
Thus, the unit cost of molding and painting is $11.91 and $8.31 respectively.
c.
Compute the cost per unit for the service department costs which are allocated to the production departments. Also, identify whether the company meets management’s standards of keeping service department costs below $3.50 per unit.
Answer to Problem 48P
The unit cost of the service department for the molding and painting department is $5.03 and $3.46.
Explanation of Solution
Joint cost allocation:
Joint cost is the cost that occurs for two or more products of a business. When two or more products have the same production process then they share some common cost, that common cost is known as the joint cost of the production.
Calculate the molding cost per unit:
Calculate the painting cost per unit:
Thus, the unit cost of the service department for the molding and painting department is $5.03 and $3.46 respectively.
Working note 4:
Calculate the service department cost:
| Particulars | Molding | Painting |
| Maintenance | $104,000 | $54,000 |
| Accounting | $163,830 | $234,042 |
| Administration | $235,302 | $58,826 |
| Total service costs | $503,132 | $346,868 |
Table: (5)
Want to see more full solutions like this?
Chapter 11 Solutions
Fundamentals of Cost Accounting


- Product decisions under bottlenecked operations Mill Metals Inc. has three grades of metal product, Type 5, Type 10, and Type 20. Financial data for the three grades are as follows: Mills operations require all three grades to be melted in a furnace before being formed. The furnace runs 24 hours a day, 7 days a week, and is a production bottleneck. The furnace hours required per unit of each product are as follows: The Marketing Department is considering a new marketing and sales campaign. Which product should be emphasized in the marketing and sales campaign in order to maximize profitability?arrow_forwardRoper Furniture manufactures office furniture and tracks cost data across their process. The following are some of the costs that they incur. Classify these costs as fixed or variable costs, and as product costs or period costs. Wood used to produce desks ($125,00 per desk) Production labor used to produce desks ($15 per hour) Production supervisor salary ($45,000 per year) Depreciation on factory equipment ($60,000 per year) Selling and administrative expenses ($45,000 per year) Rent on corporate office ($44,000 per year) Nails, glue, and other materials required to produce desks (varies per desk) Utilities expenses for production facility Sales staff commission (5% of gross sales)arrow_forwardAnalyze Horsepower Hookup, Inc. Horsepower Hookup, Inc., is a large automobile company that specializes in the production of high-powered trucks. The company is determining cost allocations for purposes of performance evaluation. A portion of company bonuses depends on divisions achieving cost management goals. This necessitates highly accurate support department cost allocation. Management has also stated that it has the means to implement as complex a method as necessary. The general manager over the Mid-Size D wants to get a good idea of what factors are driving the costs of the support departments in order to make accurate cost allocations, so finding accurate support department cost drivers is important. Support department costs include Janitorial (163,100) and Security (285,400). The Janitorial costs vary depending on the number of vehicles produced, increasing with larger production volumes. Security costs are fixed based on the size of the lot, and do not change with respect to how many vehicles are in the lot or warehouse. Joint costs involved in producing the trucks before the split-off point where the various makes, models, and colors are produced are 946,000 for the period. All makes, models, and colors sell at relatively similar margins, but the sports models and metallic colors are normally more difficult to produce during the joint production process. a. Which support department cost allocation method (direct, sequential, or reciprocal services) should be used to allocate support department cost? b. What driver would be best for allocating Janitorial costs? c. What driver would be best for allocating Security costs? d. If Janitorial costs were to be allocated based on square footage, and Security costs based on asset value, what percentage of each support departments costs would be allocated to each production department using the sequential method (allocating Security costs first) given the following: e. Should Janitorial and Security costs be considered when evaluating the performance of cost management employees? f. What joint cost allocation method should be used for performance evaluation purposes?arrow_forward
- Hart Manufacturing makes three products. Each product requires manufacturing operations in three departments: A, B, and C. The labor-hour requirements, by department, are as follows: During the next production period the labor-hours available are 450 in department A, 350 in department B, and 50 in department C. The profit contributions per unit are 25 for product 1, 28 for product 2, and 30 for product 3. a. Formulate a linear programming model for maximizing total profit contribution. b. Solve the linear program formulated in part (a). How much of each product should be produced, and what is the projected total profit contribution? c. After evaluating the solution obtained in part (b), one of the production supervisors noted that production setup costs had not been taken into account. She noted that setup costs are 400 for product 1, 550 for product 2, and 600 for product 3. If the solution developed in part (b) is to be used, what is the total profit contribution after taking into account the setup costs? d. Management realized that the optimal product mix, taking setup costs into account, might be different from the one recommended in part (b). Formulate a mixed-integer linear program that takes setup costs provided in part (c) into account. Management also stated that we should not consider making more than 175 units of product 1, 150 units of product 2, or 140 units of product 3. e. Solve the mixed-integer linear program formulated in part (d). How much of each product should be produced and what is the projected total profit contribution? Compare this profit contribution to that obtained in part (c).arrow_forwardMott Company recently implemented a JIT manufacturing system. After one year of operation, Heidi Burrows, president of the company, wanted to compare product cost under the JIT system with product cost under the old system. Motts two products are weed eaters and lawn edgers. The unit prime costs under the old system are as follows: Under the old manufacturing system, the company operated three service centers and two production departments. Overhead was applied using departmental overhead rates. The direct overhead costs associated with each department for the year preceding the installation of JIT are as follows: Under the old system, the overhead costs of the service departments were allocated directly to the producing departments and then to the products passing through them. (Both products passed through each producing department.) The overhead rate for the Machining Department was based on machine hours, and the overhead rate for assembly was based on direct labor hours. During the last year of operations for the old system, the Machining Department used 80,000 machine hours, and the Assembly Department used 20,000 direct labor hours. Each weed eater required 1.0 machine hour in Machining and 0.25 direct labor hour in Assembly. Each lawn edger required 2.0 machine hours in Machining and 0.5 hour in Assembly. Bases for allocation of the service costs are as follows: Upon implementing JIT, a manufacturing cell for each product was created to replace the departmental structure. Each cell occupied 40,000 square feet. Maintenance and materials handling were both decentralized to the cell level. Essentially, cell workers were trained to operate the machines in each cell, assemble the components, maintain the machines, and move the partially completed units from one point to the next within the cell. During the first year of the JIT system, the company produced and sold 20,000 weed eaters and 30,000 lawn edgers. This output was identical to that for the last year of operations under the old system. The following costs have been assigned to the manufacturing cells: Required: 1. Compute the unit cost for each product under the old manufacturing system. 2. Compute the unit cost for each product under the JIT system. 3. Which of the unit costs is more accurate? Explain. Include in your explanation a discussion of how the computational approaches differ. 4. Calculate the decrease in overhead costs under JIT, and provide some possible reasons that explain the decrease.arrow_forwardAssume that at the beginning of 20x2, Cicleta trained the 2 assembly workers in a new approach that had the objective of increasing the efficiency of the assembly process. Cicleta also began moving toward a JIT purchasing and manufacturing system. When JIT is fully implemented, the demand for expediting is expected to be virtually eliminated. It is expected to take two to three years for full implementation. Assume that receiving cost is a step-fixed cost with steps of 1,500 orders. The other three activities employ resources that are acquired as used and needed. At the end of 20x2, the following results were reported for the four activities: Required: 1. Prepare a trend report that shows the non-value-added costs for each activity for 20x1 and 20x2 and the change in costs for the two periods. Discuss the reports implications. 2. Explain the role of activity reduction for receiving and for expediting. What is the expected value of SQ for each activity after JIT is fully implemented? 3. What if at the end of 20x2, the selling price of a competing product is reduced by 27 per unit? Assume that the firm produces and sells 20,000 units of its product and that its product is associated only with the four activities being considered. By virtue of the waste-reduction savings, can the competitors price reduction be matched without reducing the unit profit margin of the product that prevailed at the beginning of the year? If not, how much more waste reduction is needed to achieve this outcome? In this case, what price decision would you recommend?arrow_forward
- Jolene Askew, manager of Feagan Company, has committed her company to a strategically sound cost reduction program. Emphasizing life-cycle cost management is a major part of this effort. Jolene is convinced that production costs can be reduced by paying more attention to the relationships between design and manufacturing. Design engineers need to know what causes manufacturing costs. She instructed her controller to develop a manufacturing cost formula for a newly proposed product. Marketing had already projected sales of 25,000 units for the new product. (The life cycle was estimated to be 18 months. The company expected to have 50 percent of the market and priced its product to achieve this goal.) The projected selling price was 20 per unit. The following cost formula was developed: Y=200,000+10X1 where X1=Machinehours(Theproductisexpectedtouseonemachinehourforeveryunitproduced.) Upon seeing the cost formula, Jolene quickly calculated the projected gross profit to be 50,000. This produced a gross profit of 2 per unit, well below the targeted gross profit of 4 per unit. Jolene then sent a memo to the Engineering Department, instructing them to search for a new design that would lower the costs of production by at least 50,000 so that the target profit could be met. Within two days, the Engineering Department proposed a new design that would reduce unit-variable cost from 10 per machine hour to 8 per machine hour (Design Z). The chief engineer, upon reviewing the design, questioned the validity of the controllers cost formula. He suggested a more careful assessment of the proposed designs effect on activities other than machining. Based on this suggestion, the following revised cost formula was developed. This cost formula reflected the cost relationships of the most recent design (Design Z). Y=140,000+8X1+5,000X2+2,000X3 where X1=MachinehoursX2=NumberofbatchesX3=Numberofengineeringchangeorders Based on scheduling and inventory considerations, the product would be produced in batches of 1,000; thus, 25 batches would be needed over the products life cycle. Furthermore, based on past experience, the product would likely generate about 20 engineering change orders. This new insight into the linkage of the product with its underlying activities led to a different design (Design W). This second design also lowered the unit-level cost by 2 per unit but decreased the number of design support requirements from 20 orders to 10 orders. Attention was also given to the setup activity, and the design engineer assigned to the product created a design that reduced setup time and lowered variable setup costs from 5,000 to 3,000 per setup. Furthermore, Design W also creates excess activity capacity for the setup activity, and resource spending for setup activity capacity can be decreased by 40,000, reducing the fixed cost component in the equation by this amount. Design W was recommended and accepted. As prototypes of the design were tested, an additional benefit emerged. Based on test results, the post-purchase costs dropped from an estimated 0.70 per unit sold to 0.40 per unit sold. Using this information, the Marketing Department revised the projected market share upward from 50 percent to 60 percent (with no price decrease). Required: 1. Calculate the expected gross profit per unit for Design Z using the controllers original cost formula. According to this outcome, does Design Z reach the targeted unit profit? Repeat, using the engineers revised cost formula. Explain why Design Z failed to meet the targeted profit. What does this say about the use of unit-based costing for life-cycle cost management? 2. Calculate the expected profit per unit using Design W. Comment on the value of activity information for life-cycle cost management. 3. The benefit of the post-purchase cost reduction of Design W was discovered in testing. What direct benefit did it create for Feagan Company (in dollars)? Reducing post-purchase costs was not a specific design objective. Should it have been? Are there any other design objectives that should have been considered?arrow_forwardCost Classification, Income Statement Gateway Construction Company, run by Jack Gateway, employs 25 to 30 people as subcontractors for laying gas, water, and sewage pipelines. Most of Gateways work comes from contracts with city and state agencies in Nebraska. The companys sales volume averages 3 million, and profits vary between 0 and 10% of sales. Sales and profits have been somewhat below average for the past 3 years due to a recession and intense competition. Because of this competition, Jack constantly reviews the prices that other companies bid for jobs. When a bid is lost, he analyzes the reasons for the differences between his bid and that of his competitors and uses this information to increase the competitiveness of future bids. Jack believes that Gateways current accounting system is deficient. Currently, all expenses are simply deducted from revenues to arrive at operating income. No effort is made to distinguish among the costs of laying pipe, obtaining contracts, and administering the company. Yet all bids are based on the costs of laying pipe. With these thoughts in mind, Jack looked more carefully at the income statement for the previous year (see below). First, he noted that jobs were priced on the basis of equipment hours, with an average price of 165 per equipment hour. However, when it came to classifying and assigning costs, he needed some help. One thing that really puzzled him was how to classify his own 114,000 salary. About half of his time was spent in bidding and securing contracts, and the other half was spent in general administrative matters. Required: 1. Classify the costs in the income statement as (1) costs of laying pipe (production costs), (2) costs of securing contracts (selling costs), or (3) costs of general administration. For production costs, identify direct materials, direct labor, and overhead costs. The company never has significant work in process (most jobs are started and completed within a day). 2. Assume that a significant driver is equipment hours. Identify the expenses that would likely be traced to jobs using this driver. Explain why you feel these costs are traceable using equipment hours. What is the cost per equipment hour for these traceable costs?arrow_forwardProduction run size and activity improvement Littlejohn, Inc., manufactures machined parts for the automotive industry. The activity cost associated with Part XX-10 is as follows: Each unit requires 30 minutes of fabrication direct labor. Moreover, Part XX-10 is manufactured in production run sizes of 50 units. Each production run is set up, scheduled (production control), and moved as a batch of 50 units. Management is considering improvements in the setup, production control, and moving activities in order to cut the production run sizes by half. As a result, the number of setups, production runs, and moves will double from 10 to 20. Such improvements are expected to speed the companys ability to respond to customer orders. Setup is reengineered so that it takes 60% of the original cost per setup. Production control software will allow production control effort and cost per production run to decline by 60%. Moving distance was reduced by 40%, thus reducing the cost per move by the same amount. A. Determine the revised activity cost per unit under the proposed changes. B. Did these improvements reduce the activity cost per unit? C. What cost per unit for setup would be required for the solution in (a) to equal the base solution?arrow_forward
- Charlies Wood Works produces wood products (e.g., cabinets, tables, picture frames, and so on). Production departments include Cutting and Assembly. The Janitorial and Security departments support the Cutting and Assembly departments. The Assembly Department spans about 46,400 square feet and holds assets valued at about 60,000. The Cutting Department spans about 33,600 square feet and holds assets valued at about 140,000. Charlies Wood Works allocates support department costs using the direct method. If costs from the Janitorial Department are allocated based on square feet and costs from the Security Department are allocated based on asset value, determine (a) the percentage of Janitorial costs that should be allocated to the Assembly Department and (b) the percentage of Security costs that should be allocated to the Cutting Department.arrow_forwardHandbrain Inc. is considering a change to activity-based product costing. The company produces two products, cell phones and tablet PCs, in a single production department. The production department is estimated to require 2,000 direct labor hours. The total indirect labor is budgeted to be 200,000. Time records from indirect labor employees revealed that they spent 30% of their time setting up production runs and 70% of their time supporting actual production. The following information about cell phones and tablet PCs was determined from the corporate records: a. Determine the indirect labor cost per unit allocated to cell phones and tablet PCs under a single plantwide factory overhead rate system using the direct labor hours as the allocation base. b. Determine the budgeted activity costs and activity rates for the indirect labor under activity-based costing. Assume two activitiesone for setup and the other for production support. c. Determine the activity cost per unit for indirect labor allocated to each product under activity-based costing. d. Why are the per-unit allocated costs in (a) different from the per-unit activity cost assigned to the products in (c)?arrow_forwardProduct costing and decision analysis for a service company Blue Star Airline provides passenger airline service, using small jets. The airline connects four major cities: Charlotte, Pittsburgh, Detroit, and San Francisco. The company expects to fly 170,000 miles during a month. The following costs are budgeted for a month: Blue Star management wishes to assign these costs to individual flights in order to gauge the profitability of its service offerings. The following activity bases were identified with the budgeted costs: The size of the companys ground operation in each city is determined by the size of the workforce. The following monthly data are available from corporate records for each terminal operation: Three recent representative flights have been selected for the profitability study. Their characteristics are as follows: Instructions Determine the fuel, crew, and depreciation cost per mile flown. Determine the cost per arrival or departure by terminal city. Use the information in (1) and (2) to construct a profitability report for the three flights. Each flight has a single arrival and departure to its origin and destination city pairs.arrow_forward
 Managerial AccountingAccountingISBN:9781337912020Author:Carl Warren, Ph.d. Cma William B. TaylerPublisher:South-Western College Pub
 Financial And Managerial AccountingAccountingISBN:9781337902663Author:WARREN, Carl S.Publisher:Cengage Learning,
 Managerial Accounting: The Cornerstone of Busines...AccountingISBN:9781337115773Author:Maryanne M. Mowen, Don R. Hansen, Dan L. HeitgerPublisher:Cengage Learning
 Essentials of Business Analytics (MindTap Course ...StatisticsISBN:9781305627734Author:Jeffrey D. Camm, James J. Cochran, Michael J. Fry, Jeffrey W. Ohlmann, David R. AndersonPublisher:Cengage Learning
 Cornerstones of Cost Management (Cornerstones Ser...AccountingISBN:9781305970663Author:Don R. Hansen, Maryanne M. MowenPublisher:Cengage Learning
 Principles of Accounting Volume 2AccountingISBN:9781947172609Author:OpenStaxPublisher:OpenStax College