
Concept explainers
Videos
Hours of Television by Age Group The StatCrunch output shows the ANOVA results for testing whether there is an association between the number of hours of TV watched per week and age group: 50 and over (AdultTV), college students (TeenTV), and grade school students (ChildTV).
a. Test the hypothesis that people in different age groups spend different amounts of time, on average, watching television. Use a significance level of 0.05. Assume that the conditions for ANOVA are met.
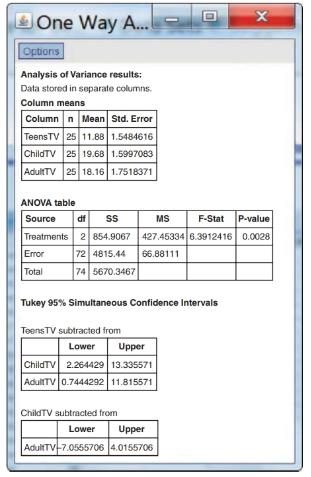
b. Using the output provided, determine which sample means are significantly different from each other. Report all the given confidence intervals for the difference between means, and tell what they show. Then arrange the groups with lowest
Want to see the full answer?
Check out a sample textbook solution
Chapter 11 Solutions
Introductory Statistics Plus Mylab Statistics With Pearson Etext -- Access Card Package (3rd Edition)
Additional Math Textbook Solutions
EBK STATISTICAL TECHNIQUES IN BUSINESS
Fundamentals of Statistics (5th Edition)
Statistics: The Art and Science of Learning from Data (4th Edition)
Elementary Statistics
Elementary Statistics (Text Only)
Probability and Statistics for Engineering and the Sciences


 Glencoe Algebra 1, Student Edition, 9780079039897...AlgebraISBN:9780079039897Author:CarterPublisher:McGraw Hill
 College Algebra (MindTap Course List)AlgebraISBN:9781305652231Author:R. David Gustafson, Jeff HughesPublisher:Cengage Learning