
Concept explainers
Videos
a.
Check whether there is sufficient evidence to conclude that the mean “appropriateness” score assigned to wearing a hat in class differs for students and faculty.
a.
Answer to Problem 61CR
The conclusion is that there is sufficient evidence to conclude that the mean “appropriateness” score assigned to wearing a hat in class differs for students and faculty.
Explanation of Solution
Calculation:
Step 1:
In this context,
Step 2:
Null hypothesis:
Step 3:
Alternative hypothesis:
Step 4:
Significance level,
It is given that the significance level,
Step 5:
Test statistic:
Step 6:
The assumption for the two-sample t-test:
- The random samples should be collected independently.
- The sample sizes should be large. That is, each sample size is at least 30.
The assumptions in this particular problem are as follows:
- Data are collected independently.
- The sample sizes are large. That is, both sample sizes are greater than 30.
Therefore, the assumptions are satisfied.
Step 7:
Test statistic:
Software procedure:
Step-by-step procedure to obtain the P-value and test statistic by using MINITAB software:
- Choose Stat > Basic Statistics > 2 sample t.
- Choose Summarized data.
- In sample 1, enter Sample size as 173, Mean as 2.80, Standard deviation as 1.
- In sample 2, enter Sample size as 98, Mean as 3.63, Standard deviation as 1.
- Choose Options.
- In Confidence level, enter 95.
- In Alternative, select not equal.
- Click OK in all the dialogue boxes.
Output obtained using the MINITAB software is given below:
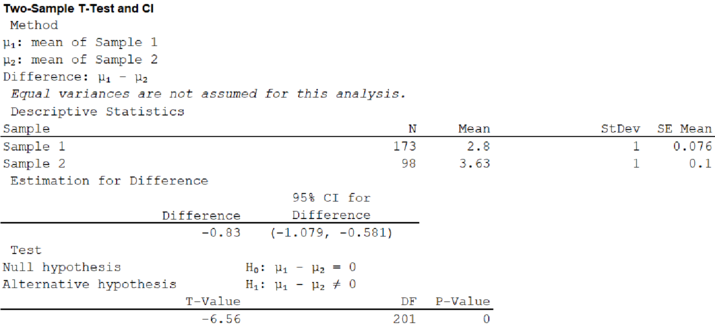
From the given MINITAB output, the value of test statistic is –6.56.
Step 8:
P-value:
From the MINITAB output, the P-value is 0.
Step 9:
Decision rule:
If
Conclusion:
Here, the
That is,
The decision is that the null hypothesis is rejected.
Hence, there is sufficient evidence to conclude that the mean “appropriateness” score assigned to wearing a hat in class differs for students and faculty.
b.
Check whether there is sufficient evidence to conclude that the mean “appropriateness” score assigned to addressing an instructor by his or her first name is greater for students than for faculty.
b.
Answer to Problem 61CR
The conclusion is that there is sufficient evidence to conclude that the mean “appropriateness” score assigned to addressing an instructor by his or her first name is greater for students than for faculty.
Explanation of Solution
Calculation:
Step 1:
In this context,
Step 2:
Null hypothesis:
Step 3:
Alternative hypothesis:
Step 4:
Significance level,
It is given that the significance level,
Step 5:
Test statistic:
Step 6:
The assumption for the two-sample t-test:
- The random samples should be collected independently.
- The sample sizes should be large. That is, each sample size is at least 30.
The assumptions in this particular problem are as follows:
- Data are collected independently.
- The sample sizes are large. That is, both sample sizes are greater than 30.
Therefore, the assumptions are satisfied.
Step 7:
Test statistic:
Software procedure:
Step-by-step procedure to obtain the P-value and test statistic by using MINITAB software:
- Choose Stat > Basic Statistics > 2 sample t.
- Choose Summarized data.
- In sample 1, enter Sample size as 173, Mean as 2.90, Standard deviation as 1.
- In sample 2, enter Sample size as 98, Mean as 2.11, Standard deviation as 1.
- Choose Options.
- In Confidence level, enter 95.
- In Alternative, select greater than.
- Click OK in all the dialogue boxes.
Output obtained using the MINITAB software is given below:
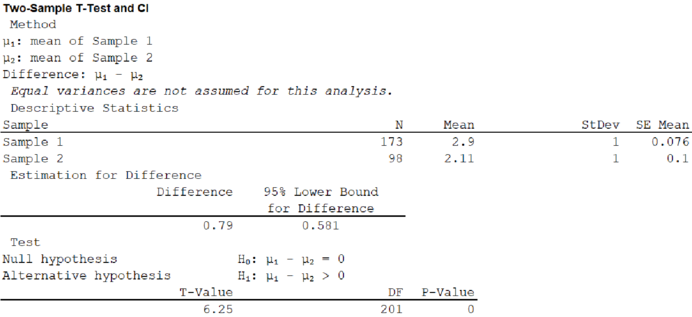
From the given MINITAB output, the value of test statistic is 6.25.
Step 8:
P-value:
From the MINITAB output, the P-value is 0.
Step 9:
Decision rule:
If
Conclusion:
Here, the
That is,
The decision is that the null hypothesis is rejected.
Hence, there is sufficient evidence to conclude that the mean “appropriateness” score assigned to addressing an instructor by his or her first name is greater for students than for faculty.
c.
Check whether there is sufficient evidence to conclude that the mean “appropriateness” score assigned to talking on a cell phone differs for students and faculty.
c.
Answer to Problem 61CR
The conclusion is that there is no sufficient evidence to conclude that the mean “appropriateness” score assigned to talking on a cell phone differs for students and faculty.
Explanation of Solution
Calculation:
Step 1:
In this context,
Step 2:
Null hypothesis:
Step 3:
Alternative hypothesis:
Step 4:
Significance level,
It is given that the significance level,
Step 5:
Test statistic:
Step 6:
The assumption for the two-sample t-test:
- The random samples should be collected independently.
- The sample sizes should be large. That is, each sample size is at least 30.
The assumptions in this particular problem are as follows:
- Data are collected independently.
- The sample sizes are large. That is, both sample sizes are greater than 30.
Therefore, the assumptions are satisfied.
Step 7:
Test statistic:
Software procedure:
Step-by-step procedure to obtain the P-value and test statistic by using MINITAB software:
- Choose Stat > Basic Statistics > 2 sample t.
- Choose Summarized data.
- In sample 1, enter Sample size as 173, Mean as 1.11, Standard deviation as 1.
- In sample 2, enter Sample size as 98, Mean as 1.10, Standard deviation as 1.
- Choose Options.
- In Confidence level, enter 95.
- In Alternative, select not equal.
- Click OK in all the dialogue boxes.
Output obtained using the MINITAB software is given below:
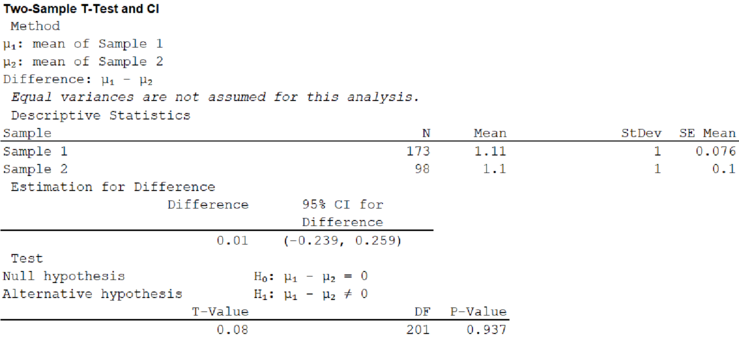
From the given MINITAB output, the value of test statistic is 0.08.
Step 8:
P-value:
From the MINITAB output, the P-value is 0.937.
Step 9:
Decision rule:
If
Conclusion:
Here, the
That is,
The decision is that the null hypothesis is not rejected.
Hence, there is no sufficient evidence to conclude that the mean “appropriateness” score assigned to talking on a cell phone differs for students and faculty.
d.
Check whether the result of the test in part (c) imply that students and faculty consider that it is acceptable to talk on a cell phone during class.
d.
Answer to Problem 61CR
No, the result of the test in part (c) does not imply that students and faculty consider that it is acceptable to talk on a cell phone during class.
Explanation of Solution
Here, the sample mean rating is lesser in both students and faculty. This shows that the behavior for the both groups is inappropriate. Hence, the result of the test in part (c) does not imply that students and faculty consider that it is acceptable to talk on a cell phone during class.
Want to see more full solutions like this?
Chapter 11 Solutions
INTRO.TO STATS.+DATA ANALYS. W/WEBASSI


 Holt Mcdougal Larson Pre-algebra: Student Edition...AlgebraISBN:9780547587776Author:HOLT MCDOUGALPublisher:HOLT MCDOUGAL
 College Algebra (MindTap Course List)AlgebraISBN:9781305652231Author:R. David Gustafson, Jeff HughesPublisher:Cengage Learning