
Essentials Of Statistics For Business & Economics
9th Edition
ISBN: 9780357045435
Author: David R. Anderson, Dennis J. Sweeney, Thomas A. Williams, Jeffrey D. Camm, James J. Cochran
Publisher: South-Western College Pub
expand_more
expand_more
format_list_bulleted
Concept explainers
Videos
Textbook Question
Chapter 11.1, Problem 10E
Costco Customer Satisfaction. Consumer Reports uses a 100-point customer satisfaction score to rate the nation’s major chain stores. Assume that from past experience with the satisfaction rating score, a population standard deviation of σ = 12 is expected. In 2012, Costco, with its 432 warehouses in 40 states, was the only chain store to earn an outstanding rating for overall quality. A sample of 15 Costco customer satisfaction scores follows.
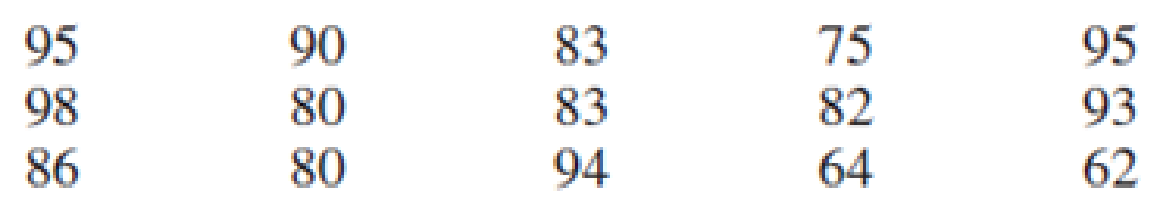
- a. What is the sample mean customer satisfaction score for Costco?
- b. What is the sample variance?
- c. What is the sample standard deviation?
- d. Construct a hypothesis test to determine whether the population standard deviation of σ = 12 should be rejected for Costco. With a .05 level of significance, what is your conclusion?
Expert Solution & Answer

Trending nowThis is a popular solution!

Chapter 11 Solutions
Essentials Of Statistics For Business & Economics
Ch. 11.1 - 1. Find the following chi-square distribution...Ch. 11.1 - Prob. 2ECh. 11.1 - A sample of 16 items provides a sample standard...Ch. 11.1 - Package Delivery by Drones. Amazon.com is testing...Ch. 11.1 - College Basketball Coaches’ Salaries. In 2018,...Ch. 11.1 - Volatility of General Electric Stock. To analyze...Ch. 11.1 - Halloween Spending. In 2017, Americans spent a...Ch. 11.1 - Variability in Daily Change in Stock Price....Ch. 11.1 - Aerospace Part Manufacturing. The competitive...Ch. 11.1 - Costco Customer Satisfaction. Consumer Reports...
Ch. 11.1 - Variability in GMAT Scores. In 2016, the Graduate...Ch. 11.1 - Vehicle Ownership by Fortune Magazine Subscribers....Ch. 11.2 - Find the following F distribution values from...Ch. 11.2 - A sample of 16 items from population 1 has a...Ch. 11.2 - Prob. 15ECh. 11.2 - Comparing Risk of Mutual Funds. Investors commonly...Ch. 11.2 - Repair Costs as Automobiles Age. In its 2016 Auto...Ch. 11.2 - Prob. 18ECh. 11.2 - Prob. 19ECh. 11.2 - Prob. 20ECh. 11.2 - Smartphone Battery Life. Battery life is an...Ch. 11.2 - Prob. 22ECh. 11 - 23. Because of staffing decisions, managers of the...Ch. 11 - Prob. 24SECh. 11 - Business Travel Costs. According to the 2017...Ch. 11 - Manufacture of Ball Bearings. Ball bearing...Ch. 11 - Count Chocula Cereal. Filling boxes with...Ch. 11 - OrderUp Food Delivery. OrderUp is a service that...Ch. 11 - Daily Patient Volume at Dental Clinic. A sample of...Ch. 11 - A sample standard deviation for the number of...Ch. 11 - Golf Scores. Is there any difference in the...Ch. 11 - Grade Point Average Comparison. The grade point...Ch. 11 - Weekly Cost Reporting. Stable cost reporting in a...Ch. 11 - Lean Process Improvement at the New York City Food...Ch. 11 - An Air Force introductory course in electronics...Ch. 11 - Meticulous Drill Reamer (MDR) specializes in...
Knowledge Booster


Learn more about
Need a deep-dive on the concept behind this application? Look no further. Learn more about this topic, statistics and related others by exploring similar questions and additional content below.Recommended textbooks for you
 Glencoe Algebra 1, Student Edition, 9780079039897...AlgebraISBN:9780079039897Author:CarterPublisher:McGraw Hill
Glencoe Algebra 1, Student Edition, 9780079039897...
Algebra
ISBN:9780079039897
Author:Carter
Publisher:McGraw Hill
The Shape of Data: Distributions: Crash Course Statistics #7; Author: CrashCourse;https://www.youtube.com/watch?v=bPFNxD3Yg6U;License: Standard YouTube License, CC-BY
Shape, Center, and Spread - Module 20.2 (Part 1); Author: Mrmathblog;https://www.youtube.com/watch?v=COaid7O_Gag;License: Standard YouTube License, CC-BY
Shape, Center and Spread; Author: Emily Murdock;https://www.youtube.com/watch?v=_YyW0DSCzpM;License: Standard Youtube License