
Concept explainers
Videos
Preliminary data analyses and other information suggest that you can reasonably assume that the variables under consideration in Exercises 11.21–11.26 are
11.23 Process Capability. R. Morris and E. Watson studied various aspects of process capability in the paper “Determining Process Capability in a Chemical Batch Process” (Quality Engineering, Vol. 10(2), pp. 389–396). In one part of the study, the researchers compared the variability in product (as measured by standard deviation) of a particular piece of equipment to a known analytic capability to decide whether product consistency could be improved. The following data were obtained for 10 batches of product.
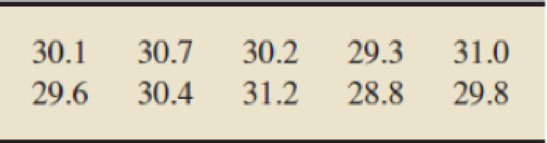
At the 1% significance level, do the data provide sufficient evidence to conclude that the product variability for this piece of equipment exceeds the analytic capability of 0.27? (Note: s = 0.756.)
Want to see the full answer?
Check out a sample textbook solution
Chapter 11 Solutions
Introductory Statistics, Books a la Carte Plus NEW MyLab Statistics with Pearson eText -- Access Card Package (10th Edition)


- Cash flow and profits are both crucial aspects of a business. Profit is the surplus revenue after deducting business expenses. Cash flow is the total amount of cash moving in and out of your business. For a business to be successful in the long term, it needs to generate profits while also operating with positive cash flow. During the Covid-19 pandemic, however, of a random sample of 199 auditors, 104 indicated some measure of agreement with this statement: cash flow is more important to keep the business operating on a day-to-day basis. a) Investigate the claim that one-half of the members of this population would agree with this statement. Also, find and interpret the p-value of this test. b) Find the probability of accepting the claim with a 10%-level test if, in fact, 60% of all auditors agree that cash flow is an important indicator to keep the business operating on a day-to-day basis.arrow_forward2. The city council is considering a law that would ban concealed weapons in all public facilities. A sample has been selected from the community and surveyed about support for the proposed ordinance. Is there a statistically significant relationship between age and support for the law against carrying concealed weapons (use p=.05, χ2(critical) = 3.841)? Use the five step model as a guide and write a sentence or two interpreting your results. Age Under 40 40 and older Support For 142 77 219 Against 106 170 276 248 247 495arrow_forward2. Does the herb Echinacea help the common cold? A study investigated the impact of echinacea vs. a standard cold medication on cold symptoms. Each subject in the study chose to take either the echinacea or a standard cold medication in capsule fom After taking the capsule for one week, the subjects then reported to the researchers the status of their cold symptoms. The researchers subsequently reported that there was no statistically significant difference in the duration of the cold between these groups. Identify the type of study. a) Cluster sample b) Social acceptability bias c) Experiment d) Observational studyarrow_forward
- A manufacturer of a new medication on the market for Parkinson's disease makes a claim that the medication is effective in 75% of people who have the disease. One hundred fifty individuals with Parkinson's disease are given the medication, and 100 of them note the medication was effective. Does this finding provide statistical evidence at the 0.05 level that the effectiveness is less than the 75% claim the company made? Make sure to include parameter, conditions, calculations, and a conclusion in your answer.arrow_forward7.28 Fuel efficiency of manual and automatic cars, part 1. each year the US environmental protection agency (EPA) releases fuel economy data on cars manufactured in that year. below are summary statistics on fuel efficacy (in miles/gallon) from random samples of cars with manual and automatic transmissions. do these data provide strong evidence of a difference between the average fuel efficiency of cars with manual and automatic transmissions in terms of their average city mileage? assume that conditions for inference are satisfied. Automatic Mean = 16.12 Automatic SD = 3.58 n = 26 Manual mean = 19.85 manual SD = 4.51 n = 26arrow_forwardThe dataset below was collected from a survey to determine whether CFT development in the island can be used as a strategy for the sustainable management and utilization of the fishery and aquatic resources in small islands. It shows the monthly income (in thousand pesos) estimated by 200 randomly selected fishers in Guimaras according to the type of fishers (i.e., the income source of fishers is solely fishing or they have alternative/supplemental livelihood such as island hopping services, sari-sari store ownership, fish value adding and/or vending, souvenir selling, carpentry, as construction worker, farming and tour guiding) and their perceived benefit from CFT development in the island. From this dataset and using = 0.05, is there a significant difference in estimated monthly income due tofisher type? How about due to the CFT perceived benefit? How about due to the interaction between fishertype and the perceived CFT benefit?a. Analyze manually and assume that the…arrow_forward
- Physical properties of six flame-retardant fabric samples were investigated in an article. Use the accompanying data and a 0.05 significance level to determine whether a linear relationship exists between stiffness x (mg-cm) and thickness y (mm). State the appropriate null and alternative hypotheses. O Ho: P = 0 H₂: P 0 O Ho: P #O H₂: p=0 O Ho: P = 0 H₁₂ :P #0 8.07 24.69 12.33 6.85 24.22 35.69 y 0.29 0.65 0.31 0.27 0.80 0.57 Compute the value of the sample correlation coefficient, r. Round your answer to four decimal places. r= Calculate the test statistic and determine the P-value. (Round your test statistic to two decimal places and your P-value to three decimal places.) t = P-value = State the conclusion in the problem context. O Fail to reject Ho. The data does not indicate that the population correlation coefficient differs from 0. Reject Ho. The data does not indicate that the population correlation coefficient differs from 0. Fail to reject Ho. The data indicates that the…arrow_forwardProcess Capability. R. Morris and E. Watson studied various aspects of process capability in the paper “Determining Process Capability in a Chemical Batch Process” (Quality Engineering, Vol. 10(2), pp. 389–396). In one part of the study, the researchers compared the variability in product of a particular piece of equipment to a known analytic capability to decide whether product consistency could be improved. The following data were obtained for 10 batches of product. 30.1 30.7 30.2 29.3 31.0 29.6 30.4 31.2 28.8 29.8 Construct a stem-and-leaf diagram for these data with a. one line per stem.b. two lines per stem.c. Which stem-and-leaf diagram do you find more useful? Why?arrow_forwardAccording to the World Bank’s year 2015 estimates of the Poverty Overview, 10% of the world population lived on less than US $1.90 a day. Angela, a development economist, wants to conduct a comparative study in her local community of the Bronx, New York. She randomly selects 200 individuals from the Bronx and finds that 0% of the sample is living below $1.90 a day. Using this information, clearly identify the parameter and statistic. Using this information, the parameter is ______ and statistic is _______ respectively. Select one: a. 10%, 200 b. $1.90, 200 c. 10%, 0% d. 0%, 10%arrow_forward
- Exercise A: In building an arena, steel bars with a mean ultimate tensile strength of 400 Megapascal (MPa) with a variance of 81 MPa were delivered by the manufacturer. The project engineer tested 50 steel bars and found out that the mean ultimate tensile strength is 390 MPa. The decision for the extension of the contract with the manufacturer depends on the engineer. Test the hypothesis whether or not there is no significant difference between the two means using a two-tailed test with α = 0.01. What are the appropriate hypotheses for the two-tailed test? What is the test statistic to be used and the reasons for its selection? What is the critical value c? What is the value of the test statistic or the computed value? Formulate a conclusion about the given situation.arrow_forwardThe relationship between the independent variable (IV) and the dependent variable (DV) is likely to be mediated by a third variable (MV). With regard to the statement above, which of the following is most likely to be correct? A IV = Students’ performance (i.e., marks) in the formative assessment; DV = Students’ performance (i.e., marks) in the summative assessment, and MV = Students’ level of comfort with the venue of the assessments B IV = Students’ performance (i.e., marks) in the summative assessment; DV = Students’ performance (i.e., marks) in the formative assessment, and MV = Students’ level of preparation for the assessments. C IV = Students’ performance (i.e., marks) in the formative assessment; DV = Students’ performance (i.e., marks) in the summative assessment, and MV = Students’ level of preparation for the assessments D IV = Students’ performance (i.e., marks) in the summative assessment; DV = Students’ performance (i.e., marks) in the formative assessment,…arrow_forward5.32 Fuel efficiency of manual and automatic cars, Part I: Each year the US Environmental Protection Agency (EPA) releases fuel economy data on cars manufactured in that year. Below are summary statistics on fuel efficiency (in miles/gallon) from random samples of cars with manual and automatic transmissions manufactured in 2012. Do these data provide strong evidence of a difference between the average fuel efficiency of cars with manual and automatic transmissions in terms of their average city mileage? Assume that conditions for inference are satisfied. City MPG, Automatic City MPG, Manual Mean 16.12 19.85 SD 3.58 4.51 n 26 26 The test statistic is:________ The p-value is: ________Interpret the result of the hypothesis test in the context of the problem: The data provide sufficient evidence that there is no difference between the average fuel efficiency of manual and automatic cars in terms of their average city mileage The data do not provide sufficient evidence…arrow_forward
 Calculus For The Life SciencesCalculusISBN:9780321964038Author:GREENWELL, Raymond N., RITCHEY, Nathan P., Lial, Margaret L.Publisher:Pearson Addison Wesley,
 Big Ideas Math A Bridge To Success Algebra 1: Stu...AlgebraISBN:9781680331141Author:HOUGHTON MIFFLIN HARCOURTPublisher:Houghton Mifflin Harcourt
 Glencoe Algebra 1, Student Edition, 9780079039897...AlgebraISBN:9780079039897Author:CarterPublisher:McGraw Hill