
Concept explainers
Videos
In Exercises 5–20, conduct the hypothesis test and provide the test statistic and the P-value and for critical value, and state the conclusion.
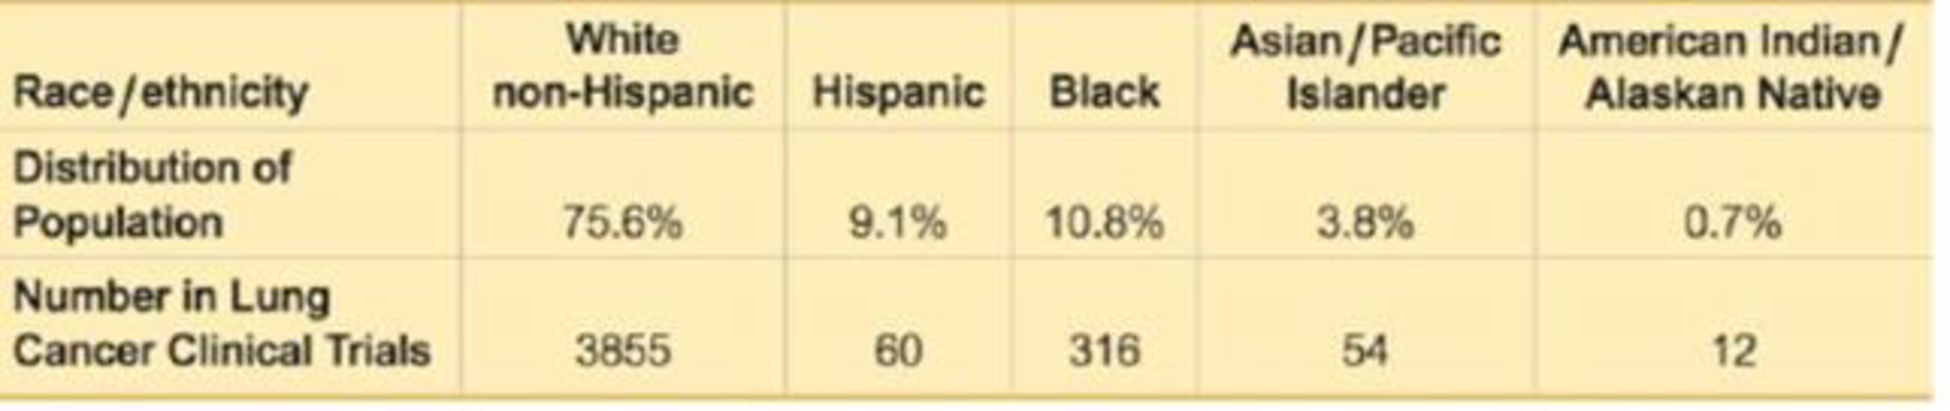
8. Bias in Clinical Trials? Researchers investigated the issue of race and equality of access to clinical trials. The following table shows the population distribution and the numbers of participants in clinical trials involving lung cancer (based on data from “Participation in Cancer Clinical Trials,” by Murthy, Krumholz, and Gross, Journal of the American Medical Association, Vol. 291, No. 22). Use a 0.01 significance level to test the claim that the distribution of clinical trial participants fits well with the population distribution. Is there a race/ethnic group that appears to be very underrepresented?

Trending nowThis is a popular solution!

Learn your wayIncludes step-by-step video

Chapter 11 Solutions
ELEMENTARY STATISTICS WITH MYSTATLAB
Additional Math Textbook Solutions
Basic Business Statistics, Student Value Edition (13th Edition)
Fundamentals of Statistics (5th Edition)
Statistics for Business and Economics (13th Edition)
STATS:DATA+MODELS-W/DVD
Intro Stats, Books a la Carte Edition (5th Edition)
Elementary Statistics Using Excel (6th Edition)


- What is meant by the sample space of an experiment?arrow_forwardAccording to the February 2008 Federal Trade Commission report on consumer fraud and identity theft, 23% of all complaints in 2007 were for identity theft. In that year, Alaska had 321 complaints of identity theft out of 1,432 consumer complaints ("Consumer fraud and," 2008). Does this data provide enough evidence to show that Alaska had a lower proportion of identity theft than 23%? Test at the 5% level. viii) Comparing p-value and α value, which is the correct decision to make for this hypothesis test? A. Reject H B. Fail to reject Ho C. Accept Ho D. Accept HA Enter letter corresponding to correct answer. (ix) Select the statement that most correctly interprets the result of this test: A. The result is statistically significant at .05 level of significance. Evidence supports the claim that the proportion of complaints due to identity theft in Alaska is less than 23%. B. The result is statistically significant at .05 level of significance. There is not…arrow_forward#2.The Gallup organization periodically polls adults living in the U.S. about the issue ofimmigration. Participants are asked whether they think immigration should increase,decrease, or stay at present levels. When this question was asked in June of 2016, 38%of respondents said they thought immigration should decrease. When it was asked inJune of 2018, 29% of respondents said they thought immigration should decrease.For the purpose of this problem, suppose that the sample size was 200 in both 2016 and2018, and that each represented a simple random sample of adults living in the U.S. atthat time. Is there evidence for a real change in opinion among U.S. adults between2016 and 2018, or do you think the results are just due to chance? Carry out all thesteps for a two-sample z test and state your conclusion. Suppose I had told you in #2 that the same people had been surveyed in 2016 and 2018.What’s the problem with carrying out the two-sample z test in this case?arrow_forward
- In Exercises, use either the critical-value approach or the P-value approach to perform the required hypothesis test. Buckling Up. The National Highway Traffic Safety Administration collects data on seat-belt use and publishes results in the document Occupant Restraint Use. Of 1000 drivers 16–24 years old, 79% said that they buckle up, whereas 924 of 1100 drivers 25–69 years old said that they did. At the 1% significance level, do the data provide sufficient evidence to concludethat there is a difference in seat-belt use between the two age groups?arrow_forwardCan you help me determine the test statistic, the P-value, and the conclusion for this hypothesis test?arrow_forwardThe College board provided comparisons of Scholastic Aptitude Test scores based on the highest level of education attained by the test taker's parents. A research hypothesis was that students whose parents had attained a higher level of education would on average score higher on the SAT. SAT verbal scores for independent samples of students follow. The first sample shows the SAT verbal test scores for students whose parents are college graduates with a bachelor's degree. The second sample shows the SAT verbal test scores for students whose parents are high school graduates but do not have a college degree. (a) Carry out a test of hypothesis at the 0.05 level that can be used to determine whether the sample data support the hypothesis that the two independent groups have equal population variances. Follow the 8-step procedure. (b) Carry out a test of hypothesis at the 0.05 level that can be used to determine whether the sample data support…arrow_forward
- A survey was conducted to investigate the relationship between gender (male and females) and sector of employment (private, government and academia). Using the information provided, does a relationship exist between gender and employment sector at the 5% significance level? Define the null hypothesis and the alternative hypothesis. A. H0: Gender and employment sector are independent vs H1: A relationship exists between gender and employment sector B. H1: Gender and employment sector are independent vs H0: No relationship exists between gender and employment sector C. H1: Gender and employment sector are independent vs H0: Gender is dependent on employment sector D. H0: A relationship exists between gender and employment sector vs H1: No relationship exists between gender and employment sectorarrow_forwardA poll is to be conducted in which 2,500 individuals are asked whether they are in favor of "No Vaxx, No Ride Policy being implemented by the local government. The 2, 500 individuals were randomly selected through random-digit telephone dialing and asked the question over the phone. What is the relevant population? What is the variable of interest? Is it quantitative or qualitative" What is the sample? What is the inference of interest to the pollster? What method of data collection is employed? How likely is the sample to be representative?arrow_forwardState two reasons why including the P-value is prudent when you are reporting the results of a hypothesis test.arrow_forward
- The Knight Foundation investigates whether high school students agreed with the statement that people should be allowed to burn or deface the American flag as a political statement. This question was asked in a survey of a representative sample of high school students in 2004 and also in a survey of a representative sample of high school students in 2014. Suppose that the sample size was 1000 in each of the two years. Data consistent with summary values given in the paper are summarized in the accompanying table. Is there convincing evidence that the proportions falling into each of the response categories were not the same for high school students in 2004 and 2014?arrow_forwardThe Knight Foundation investigates whether high school students agreed with the statement that people should be allowed to burn or deface the American flag as a political statement. This question was asked in a survey of a representative sample of high school students in 2004 and also in a survey of a representative sample of high school students in 2014. Suppose that the sample size was 1000 in each of the two years. Data consistent with summary values given in the paper are summarized in the accompanying table. Is there convincing evidence that the proportions falling into each of the response categories were not the same for high school students in 2004 and 2014? What type of question is this-estimation or hypothesis?What type of study is this sample data or experiment data?What type of data is this? Univariate or bivariate? Categorical or Numerical?How many samples or treatments?arrow_forward. At the 5% significance level, determine if the model is useful for predicting the number of weekly riders on public buses. In responding, construct and test any appropriate hypothesisarrow_forward
 College Algebra (MindTap Course List)AlgebraISBN:9781305652231Author:R. David Gustafson, Jeff HughesPublisher:Cengage Learning