
Videos
(a)
To find the range of data.
(a)
Answer to Problem 15E
Range=
Explanation of Solution
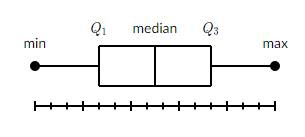
Given information: Box-and-whisker plot.
Formula Used:Range of the data=
Calculation:
As the range of the data:
So,
Range=
Hence,
Range=
(b)
To describe the distribution of data.
(b)
Answer to Problem 15E
Positively Skewed
Explanation of Solution
Given information: Box-and-whisker plot.
Calculation:

The distribution is positively skewed as the mean typically gets pulled toward the tail, and is greater than the median.
(c)
To find the interquartile range of data.
(c)
Answer to Problem 15E
Interquartile Range=
Explanation of Solution
Given information: Box-and-whisker plot.
Formula Used:Interquartile range of the data=
Calculation:

As the Interquartile range of the data =
So,
Interquartile Range=
Hence,
Interquartile Range=
(D)
To describe the data more spread out.
(D)
Answer to Problem 15E
Yes
Explanation of Solution
Given information: Box-and-whisker plot.
Calculation:

Yes, the data is more spread out.
Because range of the data is much greater than interquartile range.
Chapter 11 Solutions
BIG IDEAS MATH Integrated Math 1: Student Edition 2016


 Discrete Mathematics and Its Applications ( 8th I...MathISBN:9781259676512Author:Kenneth H RosenPublisher:McGraw-Hill Education
 Mathematics for Elementary Teachers with Activiti...MathISBN:9780134392790Author:Beckmann, SybillaPublisher:PEARSON
 Thinking Mathematically (7th Edition)MathISBN:9780134683713Author:Robert F. BlitzerPublisher:PEARSON
 Discrete Mathematics With ApplicationsMathISBN:9781337694193Author:EPP, Susanna S.Publisher:Cengage Learning,
 Pathways To Math Literacy (looseleaf)MathISBN:9781259985607Author:David Sobecki Professor, Brian A. MercerPublisher:McGraw-Hill Education