
Videos
a.
To determine the preference of the display of data amongst a histogram and two-way table.
a.
Answer to Problem 30E
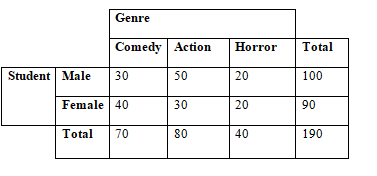
The two-table representation of the chart provided is:
Explanation of Solution
Given information:
The data given in graphical form.
The two-way table can have 3 columns that represent the types of Genre. These columns will have Comedy, Action and Horror.
There would be 2 rows that represent the gender of the students, that is Male and Female.
The table is
b.
To display the information in a two-way table.
b.
Answer to Problem 30E
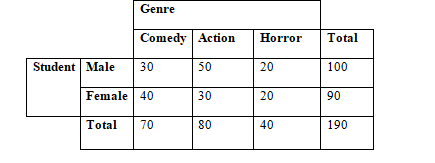
Data representation in a two-way table is preferred.
Explanation of Solution
Given information:
The data present has a histogram chart and two-way table.
A two-way table has all the data that is represented in a histogram chart. However, all the data is mentioned as numbers. This becomes easier to comprehend while calculating the various relative frequencies and reach subsequent observation.
Hence, two-way tables would be preferred over histogram charts.
Chapter 11 Solutions
BIG IDEAS MATH Integrated Math 1: Student Edition 2016


 Discrete Mathematics and Its Applications ( 8th I...MathISBN:9781259676512Author:Kenneth H RosenPublisher:McGraw-Hill Education
 Mathematics for Elementary Teachers with Activiti...MathISBN:9780134392790Author:Beckmann, SybillaPublisher:PEARSON
 Thinking Mathematically (7th Edition)MathISBN:9780134683713Author:Robert F. BlitzerPublisher:PEARSON
 Discrete Mathematics With ApplicationsMathISBN:9781337694193Author:EPP, Susanna S.Publisher:Cengage Learning,
 Pathways To Math Literacy (looseleaf)MathISBN:9781259985607Author:David Sobecki Professor, Brian A. MercerPublisher:McGraw-Hill Education