ESSENTIALS OF STATISTICS(PKG)
17th Edition
ISBN: 9781259993992
Author: Navidi
Publisher: McGraw-Hill Publishing Co.
bartleby

Concept explainers

bartleby

Videos

Question
Book Icon
Chapter 11.2, Problem 23E

a.

To determine

Find the least-squares regression line to predict the weights from heights.

a.

Expert Solution
Check Mark

Answer to Problem 23E

The least-squares regression line to predict the weights from heights is y^=107.3+1.59x_.

Explanation of Solution

Calculation:

The heights (inches) and weights (pounds) for some quarterbacks at a Combine are given.

Denote the heights as x and the weights as y.

Least-squares regression:

For an ordered pairs of values of variables, (x, y) with respective means x¯ and y¯, respective standard deviations sx and sy, correlation coefficient r, the least-squares regression line for predicting the response variable, y, by using the predictor variable, x, is given as:

y^=b0+b1x, where the slope is b1=rsysx  and the y-intercept is b0=y¯b1x¯.

Regression:

Software procedure:

Step by step procedure to obtain regression using Minitab software is given as,

  • Choose Stat > Regression > Regression > Fit Regression Model.
  • In Responses, enter the numeric column containing the response data y.
  • In Continuous Predictors, enter the numeric column containing the predictor variable x.
  • Choose Results, select Regression equation and click OK.
  • Click OK.

Output using MINITAB software is given below:

ESSENTIALS OF STATISTICS(PKG), Chapter 11.2, Problem 23E

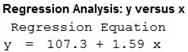
From the output, the least-squares regression line for the data set is found to be y^=107.3+1.59x_.

b.

To determine

Explain whether it is possible to give an interpretation of the y-intercept of the regression line.

b.

Expert Solution
Check Mark

Answer to Problem 23E

It is not possible to give an interpretation of the y-intercept of the regression line.

Explanation of Solution

Calculation:

Comparing the least-squares regression equation, y^=107.3+1.59x with the general form of the regression equation, the y-intercept is b0=107.3.

The y-intercept would mean that when the height of a quarterback is x=0, the weight would be 107.3.

However, it is practically impossible for the height of a quarterback to be 0 inches. The height would always take some non-zero positive value.

Hence, it is not possible to give an interpretation of the y-intercept of the regression line.

c.

To determine

Find the predicted difference in the weights of two quarterbacks, if their heights differ by 2 inches.

c.

Expert Solution
Check Mark

Answer to Problem 23E

The predicted difference in the weights of two quarterbacks, if their heights differ by 2 inches is 3.18 pounds.

Explanation of Solution

Interpretation:

It is known that when the predictor variable values differ by the amount d, the corresponding response variable values differ by amount b1d, where b1 is the slope of the least-squares regression line.

Here, d=2.

From part a, the least-squares regression equation is:

y^=107.3+1.59x.

Comparing this equation with the general form of the regression equation, b1=1.59.

Thus,

b1d=2×1.59=3.18.

Hence, the predicted difference in the weights of two quarterbacks, if their heights differ by 2 inches is 3.18 pounds.

d.

To determine

Find the weight of a quarterback whose height is 74.5 inches.

d.

Expert Solution
Check Mark

Answer to Problem 23E

The weight of a quarterback whose height is 74.5 inches is 225.755 pounds.

Explanation of Solution

Calculation:

From part a, the least-squares regression equation is:

y^=107.3+1.59x.

For a quarterback whose height is 74.5 inches, x=74.5. Replace this value of x in the equation:

y^=107.3+(1.59×74.5)=107.3+118.455=225.755.

Hence, the weight of a quarterback whose height is 74.5 inches is 225.755 pounds.

e.

To determine

Find whether the actual weight of Geno Smith is more or less than his predicted weight.

e.

Expert Solution
Check Mark

Answer to Problem 23E

The actual weight of Geno Smith is less than his predicted weight.

Explanation of Solution

Calculation:

The actual height of Geno Smith is 74 inches and his actual weight is 218 pounds.

For Geno Smith, height is 74 inches, that is, x=74. Replace this value of x in the equation:

y^=107.3+(1.59×74)=107.3+117.66=224.96.

It is observed that the predicted weight of Geno Smith is 224.96 pounds, which is greater than his actual weight of 218 pounds.

Hence, the actual weight of Geno Smith is less than his predicted weight.

Want to see more full solutions like this?

Subscribe now to access step-by-step solutions to millions of textbook problems written by subject matter experts!

Chapter 11 Solutions

ESSENTIALS OF STATISTICS(PKG)

Ch. 11.1 - Prob. 11ECh. 11.1 - Prob. 12ECh. 11.1 - Prob. 13ECh. 11.1 - Prob. 14ECh. 11.1 - Prob. 15ECh. 11.1 - Prob. 16ECh. 11.1 - Prob. 17ECh. 11.1 - Prob. 18ECh. 11.1 - Prob. 19ECh. 11.1 - Prob. 20ECh. 11.1 - Prob. 21ECh. 11.1 - Prob. 22ECh. 11.1 - Prob. 23ECh. 11.1 - Prob. 24ECh. 11.1 - Prob. 25ECh. 11.1 - Prob. 26ECh. 11.1 - Prob. 27ECh. 11.1 - In Exercises 25–30, determine whether the...Ch. 11.1 - Prob. 29ECh. 11.1 - Prob. 30ECh. 11.1 - Prob. 31ECh. 11.1 - Prob. 32ECh. 11.1 - 33. Pass the ball: The NFL Scouting Combine is an...Ch. 11.1 - 34. Carbon footprint: Carbon dioxide (CO2) is...Ch. 11.1 - 35. Foot temperatures: Foot ulcers are a common...Ch. 11.1 - Prob. 36ECh. 11.1 - Prob. 37ECh. 11.1 - Prob. 38ECh. 11.1 - Prob. 39ECh. 11.1 - Prob. 40ECh. 11.1 - Prob. 41ECh. 11.1 - Prob. 42ECh. 11.1 - Prob. 43ECh. 11.2 - 1. The following table presents the percentage of...Ch. 11.2 - 2. At the final exam in a statistics class, the...Ch. 11.2 - 3. For each of the following plots, interpret the...Ch. 11.2 - Prob. 4CYUCh. 11.2 - Prob. 5ECh. 11.2 - In Exercises 5–7, fill in each blank with the...Ch. 11.2 - Prob. 7ECh. 11.2 - Prob. 8ECh. 11.2 - In Exercises 8–12, determine whether the statement...Ch. 11.2 - Prob. 10ECh. 11.2 - Prob. 11ECh. 11.2 - Prob. 12ECh. 11.2 - Prob. 13ECh. 11.2 - Prob. 14ECh. 11.2 - Prob. 15ECh. 11.2 - Prob. 16ECh. 11.2 - Prob. 17ECh. 11.2 - Prob. 18ECh. 11.2 - Prob. 19ECh. 11.2 - Prob. 20ECh. 11.2 - Prob. 21ECh. 11.2 - Prob. 22ECh. 11.2 - Prob. 23ECh. 11.2 - Prob. 24ECh. 11.2 - Prob. 25ECh. 11.2 - Prob. 26ECh. 11.2 - 27. Blood pressure: A blood pressure measurement...Ch. 11.2 - Prob. 28ECh. 11.2 - 29. Interpreting technology: The following display...Ch. 11.2 - Prob. 30ECh. 11.2 - Prob. 31ECh. 11.2 - Prob. 32ECh. 11.2 - Prob. 33ECh. 11.2 - Prob. 34ECh. 11.2 - Prob. 35ECh. 11.3 - Prob. 1CYUCh. 11.3 - Prob. 2CYUCh. 11.3 - Prob. 3CYUCh. 11.3 - Prob. 4CYUCh. 11.3 - Prob. 5CYUCh. 11.3 - Prob. 6CYUCh. 11.3 - Prob. 7ECh. 11.3 - Prob. 8ECh. 11.3 - Prob. 9ECh. 11.3 - Prob. 10ECh. 11.3 - Prob. 11ECh. 11.3 - Prob. 12ECh. 11.3 - Prob. 13ECh. 11.3 - Prob. 14ECh. 11.3 - Prob. 15ECh. 11.3 - Prob. 16ECh. 11.3 - Prob. 17ECh. 11.3 - Prob. 18ECh. 11.3 - Calories and protein: The following table presents...Ch. 11.3 - Prob. 20ECh. 11.3 - Butterfly wings: Do larger butterflies live...Ch. 11.3 - Blood pressure: A blood pressure measurement...Ch. 11.3 - Prob. 23ECh. 11.3 - Prob. 24ECh. 11.3 - Getting bigger: Concrete expands both horizontally...Ch. 11.3 - Prob. 26ECh. 11.3 - Prob. 27ECh. 11.3 - Prob. 28ECh. 11.3 - Prob. 29ECh. 11.3 - Prob. 30ECh. 11.3 - Prob. 31ECh. 11.4 - Prob. 1CYUCh. 11.4 - Prob. 2CYUCh. 11.4 - Prob. 3ECh. 11.4 - Prob. 4ECh. 11.4 - Prob. 5ECh. 11.4 - Prob. 6ECh. 11.4 - Prob. 7ECh. 11.4 - Prob. 8ECh. 11.4 - Prob. 9ECh. 11.4 - Prob. 10ECh. 11.4 - Calories and protein: Use the data in Exercise 19...Ch. 11.4 - Prob. 12ECh. 11.4 - Butterfly wings: Use the data in Exercise 21 in...Ch. 11.4 - Prob. 14ECh. 11.4 - Prob. 15ECh. 11.4 - Prob. 16ECh. 11.4 - Prob. 17ECh. 11.4 - Prob. 18ECh. 11.4 - Prob. 19ECh. 11.4 - Prob. 20ECh. 11.4 - Prob. 21ECh. 11 - Prob. 1CQCh. 11 - Prob. 2CQCh. 11 - Prob. 3CQCh. 11 - Prob. 4CQCh. 11 - Prob. 5CQCh. 11 - Prob. 6CQCh. 11 - Prob. 7CQCh. 11 - Prob. 8CQCh. 11 - Prob. 9CQCh. 11 - Prob. 10CQCh. 11 - Prob. 11CQCh. 11 - Prob. 12CQCh. 11 - Prob. 13CQCh. 11 - Prob. 14CQCh. 11 - Prob. 15CQCh. 11 - Prob. 1RECh. 11 - Prob. 2RECh. 11 - Prob. 3RECh. 11 - Prob. 4RECh. 11 - Prob. 5RECh. 11 - Prob. 6RECh. 11 - Prob. 7RECh. 11 - Prob. 8RECh. 11 - Prob. 9RECh. 11 - Prob. 10RECh. 11 - Prob. 11RECh. 11 - Prob. 12RECh. 11 - Prob. 13RECh. 11 - Interpret technology: The following TI-84 Plus...Ch. 11 - Prob. 15RECh. 11 - Prob. 1WAICh. 11 - Prob. 2WAICh. 11 - Prob. 3WAICh. 11 - Prob. 4WAICh. 11 - Prob. 5WAICh. 11 - Prob. 6WAICh. 11 - Prob. 7WAICh. 11 - Prob. 1CSCh. 11 - Prob. 2CSCh. 11 - Prob. 3CSCh. 11 - Prob. 4CSCh. 11 - Prob. 5CSCh. 11 - Prob. 6CSCh. 11 - Prob. 7CSCh. 11 - Prob. 8CSCh. 11 - Prob. 9CSCh. 11 - Prob. 10CSCh. 11 - Prob. 11CS
Knowledge Booster
Background pattern image
Statistics
Learn more about
Need a deep-dive on the concept behind this application? Look no further. Learn more about this topic, statistics and related others by exploring similar questions and additional content below.
Recommended textbooks for you
Text book image
MATLAB: An Introduction with Applications
Statistics
ISBN:9781119256830
Author:Amos Gilat
Publisher:John Wiley & Sons Inc
Text book image
Probability and Statistics for Engineering and th...
Statistics
ISBN:9781305251809
Author:Jay L. Devore
Publisher:Cengage Learning
Text book image
Statistics for The Behavioral Sciences (MindTap C...
Statistics
ISBN:9781305504912
Author:Frederick J Gravetter, Larry B. Wallnau
Publisher:Cengage Learning
Text book image
Elementary Statistics: Picturing the World (7th E...
Statistics
ISBN:9780134683416
Author:Ron Larson, Betsy Farber
Publisher:PEARSON
Text book image
The Basic Practice of Statistics
Statistics
ISBN:9781319042578
Author:David S. Moore, William I. Notz, Michael A. Fligner
Publisher:W. H. Freeman
Text book image
Introduction to the Practice of Statistics
Statistics
ISBN:9781319013387
Author:David S. Moore, George P. McCabe, Bruce A. Craig
Publisher:W. H. Freeman
Correlation Vs Regression: Difference Between them with definition & Comparison Chart; Author: Key Differences;https://www.youtube.com/watch?v=Ou2QGSJVd0U;License: Standard YouTube License, CC-BY
Correlation and Regression: Concepts with Illustrative examples; Author: LEARN & APPLY : Lean and Six Sigma;https://www.youtube.com/watch?v=xTpHD5WLuoA;License: Standard YouTube License, CC-BY