
Concept explainers
Videos
a.
To construct: The appropriate graph that shows the relationship between two variables and interpret it.
a.
Explanation of Solution
Given:
The table is:
| Education | Yes | No |
| Less than high school | 58 | 58 |
| High school graduate | 84 | 129 |
| Some college | 169 | 294 |
| College graduate | 98 | 135 |
| Postgraduate degree | 77 | 99 |
Calculation:
To construct the graph, the proportions are computed as:
| Education | Yes | No |
| Less than high school | 0.5 | 0.5 |
| High school graduate | 0.3944 | 0.6056 |
| Some college | 0.365 | 0.635 |
| College graduate | 0.4206 | 0.5794 |
| Postgraduate degree | 0.4375 | 0.5625 |
Graph:
The figure could be constructed as:
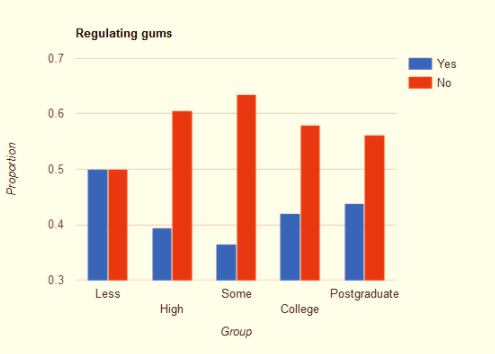
Interpretation:
From the above figure, it is clear that most of the people in each category are not supporting the law and this proportions seems to be highest in the group of “Some college”
b.
To check: If the sample is providing sufficient evidence to conclude that the level of education and opinion about a handgun ban are independent or not.
b.
Explanation of Solution
Calculation:
The appropriate null and alternative hypotheses for the provided test could be written as:
The expected count is computed as:
| Education | Yes | No |
| Less than high school | 46.9409 | 69.0591 |
| High school graduate | 86.1932 | 126.8068 |
| Some college | 187.3589 | 275.6411 |
| College graduate | 94.2864 | 138.7136 |
| Postgraduate degree | 71.2206 | 104.7794 |
The test statistic is:
The degree of freedom is calculated as:
The p-value using chi-square table at 4 degree of freedom is 0.074133
The p -value is above significance level. The null hypothesis does not get rejected. Thus, there is sufficient evidence to conclude that there is not an association between two variables.
Chapter 11 Solutions
The Practice of Statistics for AP - 4th Edition
Additional Math Textbook Solutions
Introductory Statistics
Statistical Reasoning for Everyday Life (5th Edition)
Essentials of Statistics, Books a la Carte Edition (5th Edition)
Basic Business Statistics, Student Value Edition (13th Edition)
Elementary Statistics (13th Edition)
Elementary Statistics: Picturing the World (7th Edition)


 MATLAB: An Introduction with ApplicationsStatisticsISBN:9781119256830Author:Amos GilatPublisher:John Wiley & Sons Inc
 Probability and Statistics for Engineering and th...StatisticsISBN:9781305251809Author:Jay L. DevorePublisher:Cengage Learning
 Statistics for The Behavioral Sciences (MindTap C...StatisticsISBN:9781305504912Author:Frederick J Gravetter, Larry B. WallnauPublisher:Cengage Learning
 Elementary Statistics: Picturing the World (7th E...StatisticsISBN:9780134683416Author:Ron Larson, Betsy FarberPublisher:PEARSON
 The Basic Practice of StatisticsStatisticsISBN:9781319042578Author:David S. Moore, William I. Notz, Michael A. FlignerPublisher:W. H. Freeman
 Introduction to the Practice of StatisticsStatisticsISBN:9781319013387Author:David S. Moore, George P. McCabe, Bruce A. CraigPublisher:W. H. Freeman