
Concept explainers
Videos
To plot an appropriate graph to compare the distributions of opinion about quality of life among heart attack patients in Canada and Unites States.
Explanation of Solution
Given:
The data of heart attack patients quality of life for Canada and United States is given below
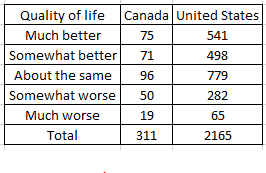
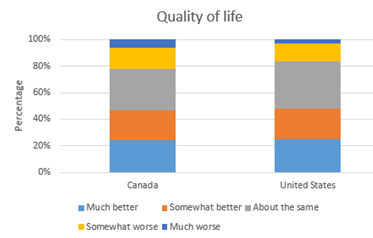
The sample sizes are different for Canada and United States heart attack patients. So we compare the individuals in each country and their quality of life, we make segmented bar graph to compare these two distributions.
Graph:
Interpretation:
Here from the plot we can say that the percentage of patients who feel much better, Somewhat better about quality of life in Canada and United States are approximately equal. The percentage of patients who feel much worse and somewhat worse are more in Canada when compared to that of heart patients in United States. The percentage of patients who feel about the same are more in United States when compared to patients in Canada. Even though there are slight differences in the distribution of quality of life, we can approximately say that there is not much difference in quality of life among heart attack patients in U.S and Canada with reference of the plot.
Chapter 11 Solutions
The Practice of Statistics for AP - 4th Edition
Additional Math Textbook Solutions
Intro Stats
Basic Business Statistics, Student Value Edition
Elementary Statistics Using Excel (6th Edition)
Elementary Statistics: Picturing the World (6th Edition)
Statistical Reasoning for Everyday Life (5th Edition)
Introductory Statistics (2nd Edition)


 MATLAB: An Introduction with ApplicationsStatisticsISBN:9781119256830Author:Amos GilatPublisher:John Wiley & Sons Inc
 Probability and Statistics for Engineering and th...StatisticsISBN:9781305251809Author:Jay L. DevorePublisher:Cengage Learning
 Statistics for The Behavioral Sciences (MindTap C...StatisticsISBN:9781305504912Author:Frederick J Gravetter, Larry B. WallnauPublisher:Cengage Learning
 Elementary Statistics: Picturing the World (7th E...StatisticsISBN:9780134683416Author:Ron Larson, Betsy FarberPublisher:PEARSON
 The Basic Practice of StatisticsStatisticsISBN:9781319042578Author:David S. Moore, William I. Notz, Michael A. FlignerPublisher:W. H. Freeman
 Introduction to the Practice of StatisticsStatisticsISBN:9781319013387Author:David S. Moore, George P. McCabe, Bruce A. CraigPublisher:W. H. Freeman