
Elementary Statistics: Picturing the World (6th Edition)
6th Edition
ISBN: 9780321911216
Author: Ron Larson, Betsy Farber
Publisher: PEARSON
expand_more
expand_more
format_list_bulleted
Concept explainers
Videos
Textbook Question
Chapter 11.3, Problem 8E
Comparing Two Tests In Exercises 7 and 8,
- (a) perform a Kruskal-Wallis test.
- (b) perform a one-way ANOVA test, assuming that each population is
normally distributed and the population variances are equal. - (c) Compare the results.
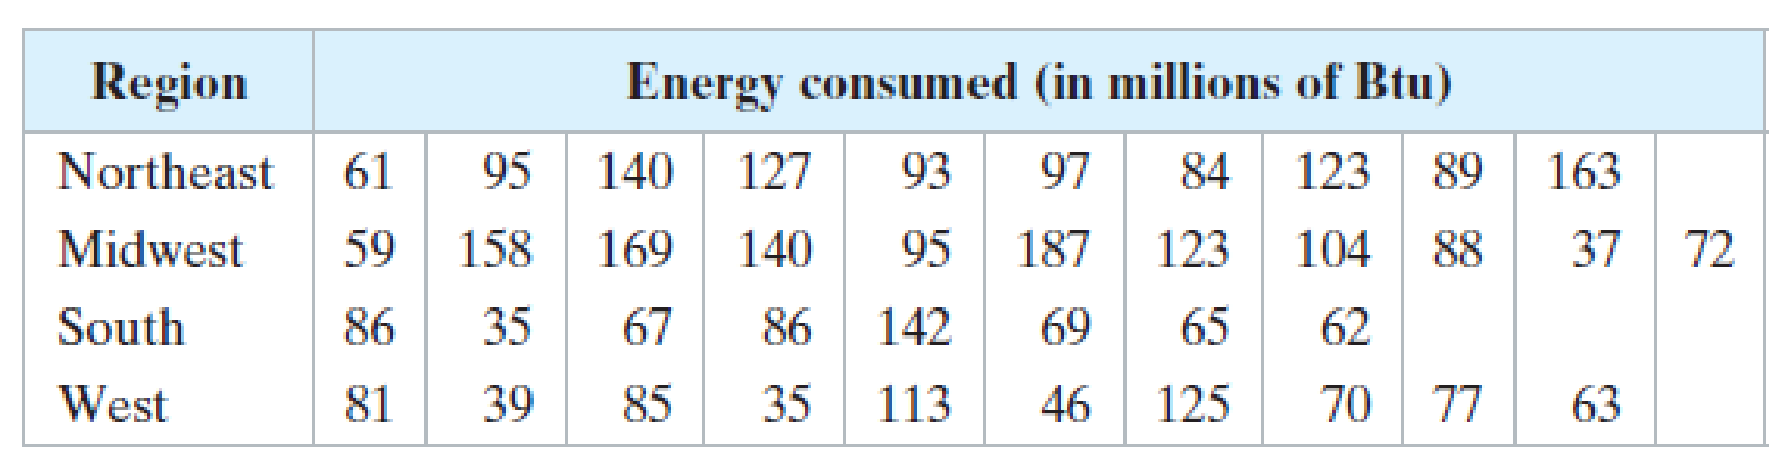
8. Energy Consumption The table shows the energy consumed (in millions of Btu) in one year for a random sample of households from four U.S. regions. At a = 0.01, can you conclude that the energy consumed is different in at least one region? (Adapted from U.S. Energy Information Administration)
Expert Solution & Answer
Want to see the full answer?
Check out a sample textbook solution
Students have asked these similar questions
Testing Claims About Variation. In Exercises 5–16, test the given claim. Identify the null hypothesis, alternative hypothesis, test statistic, P-value, or critical value(s), then state the conclusion about the null hypothesis, as well as the final conclusion that addresses the original claim. Assume that a simple random sample is selected from a normally distributed population.
Spoken Words Couples were recruited for a study of how many words people speak in a day. A random sample of 56 males resulted in a mean of 16,576 words and a standard deviation of 7871 words. Use a 0.01 significance level to test the claim that males have a standard deviation that is greater than the standard deviation of 7460 words for females (based on Data Set 24 “Word Counts”).
Testing Claims About Variation. In Exercises 5–16, test the given claim. Identify the null hypothesis, alternative hypothesis, test statistic, P-value, or critical value(s), then state the conclusion about the null hypothesis, as well as the final conclusion that addresses the original claim. Assume that a simple random sample is selected from a normally distributed population.
Coffee Vending Machines The Brazil vending machine dispenses coffee, and a random sample of 27 filled cups have contents with a mean of 7.14 oz and a standard deviation of 0.17 oz. Use a 0.05 significance level to test the claim that the machine dispenses amounts with a standard deviation greater than the standard deviation of 0.15 oz specified in the machine design.
Using Nonparametric Tests. In Exercises 1–10, use a 0.05 significance level with the indicated test. If no particular test is specified, use the appropriate nonparametric test from this chapter.
Presidents, Popes, Monarchs Listed below are numbers of years that U.S. presidents, popes, and British monarchs lived after their inauguration, election, or coronation, respectively. Assume that the data are samples randomly selected from larger populations. Test the claim that the three samples are from populations with the same median.
Chapter 11 Solutions
Elementary Statistics: Picturing the World (6th Edition)
Ch. 11.1 - Prob. 1TYCh. 11.1 - Prob. 2TYCh. 11.1 - Prob. 3TYCh. 11.1 - Prob. 1ECh. 11.1 - When the sign test is used, what population...Ch. 11.1 - Describe the test statistic for the sign test when...Ch. 11.1 - In your own words, explain why the hypothesis test...Ch. 11.1 - Explain how to use the sign test to test a...Ch. 11.1 - List the two conditions that must be met in order...Ch. 11.1 - Prob. 7E
Ch. 11.1 - Temperature A meteorologist claims that the median...Ch. 11.1 - Prob. 9ECh. 11.1 - Temperature During a weather report, a...Ch. 11.1 - Prob. 11ECh. 11.1 - Prob. 12ECh. 11.1 - Prob. 13ECh. 11.1 - Prob. 14ECh. 11.1 - Unit Size A renters organization claims that the...Ch. 11.1 - Prob. 16ECh. 11.1 - Prob. 17ECh. 11.1 - Prob. 18ECh. 11.1 - Prob. 19ECh. 11.1 - Prob. 20ECh. 11.1 - Prob. 21ECh. 11.1 - Prob. 22ECh. 11.1 - Prob. 23ECh. 11.1 - Contacting Parents A research organization...Ch. 11.1 - Prob. 25ECh. 11.1 - Prob. 26ECh. 11.1 - Prob. 27ECh. 11.1 - Ages of Grooms A marriage counselor claims that...Ch. 11.2 - Prob. 1TYCh. 11.2 - Prob. 2TYCh. 11.2 - Prob. 1ECh. 11.2 - Prob. 2ECh. 11.2 - Prob. 3ECh. 11.2 - Prob. 4ECh. 11.2 - Prob. 5ECh. 11.2 - Prob. 6ECh. 11.2 - Prob. 7ECh. 11.2 - Performing a Wilcoxon Test In Exercises 38, (a)...Ch. 11.2 - Wilcoxon Signed-Rank Test for n 30 When you are...Ch. 11.2 - Prob. 10ECh. 11.2 - Prob. 1CSCh. 11.2 - Prob. 2CSCh. 11.2 - Prob. 3CSCh. 11.2 - Prob. 4CSCh. 11.2 - Prob. 5CSCh. 11.2 - Prob. 6CSCh. 11.2 - Prob. 7CSCh. 11.3 - Prob. 1TYCh. 11.3 - Prob. 1ECh. 11.3 - Explain why the Kruskal-Wallis test is always a...Ch. 11.3 - Prob. 3ECh. 11.3 - Prob. 4ECh. 11.3 - Prob. 5ECh. 11.3 - Prob. 6ECh. 11.3 - Comparing Two Tests In Exercises 7 and 8, (a)...Ch. 11.3 - Comparing Two Tests In Exercises 7 and 8, (a)...Ch. 11.4 - Prob. 1TYCh. 11.4 - Prob. 1ECh. 11.4 - Prob. 2ECh. 11.4 - Prob. 3ECh. 11.4 - Prob. 4ECh. 11.4 - Prob. 5ECh. 11.4 - Prob. 6ECh. 11.4 - Prob. 7ECh. 11.4 - Prob. 8ECh. 11.4 - Prob. 9ECh. 11.4 - Prob. 10ECh. 11.4 - Prob. 11ECh. 11.4 - Prob. 12ECh. 11.4 - Prob. 13ECh. 11.4 - Prob. 14ECh. 11.5 - Prob. 1TYCh. 11.5 - Prob. 2TYCh. 11.5 - Prob. 3TYCh. 11.5 - In your own words, explain why the hypothesis test...Ch. 11.5 - Describe the test statistic for the runs test when...Ch. 11.5 - Finding the Number of Runs In Exercises 36,...Ch. 11.5 - Prob. 4ECh. 11.5 - Finding the Number of Runs In Exercises 36,...Ch. 11.5 - Prob. 6ECh. 11.5 - Prob. 7ECh. 11.5 - Prob. 8ECh. 11.5 - Prob. 9ECh. 11.5 - Prob. 10ECh. 11.5 - Finding Critical Values In Exercises 1114, use the...Ch. 11.5 - Prob. 12ECh. 11.5 - Prob. 13ECh. 11.5 - Prob. 14ECh. 11.5 - Prob. 15ECh. 11.5 - Prob. 16ECh. 11.5 - Prob. 17ECh. 11.5 - Prob. 18ECh. 11.5 - Prob. 19ECh. 11.5 - Prob. 20ECh. 11.5 - Prob. 21ECh. 11.5 - Prob. 22ECh. 11.5 - Runs Test with Quantitative Data In Exercises...Ch. 11 - Using an Inappropriate Test Discuss the...Ch. 11 - Prob. 11.1.1RECh. 11 - Prob. 11.1.2RECh. 11 - Prob. 11.1.3RECh. 11 - Prob. 11.1.4RECh. 11 - Prob. 11.1.5RECh. 11 - Prob. 11.1.6RECh. 11 - Prob. 11.2.7RECh. 11 - In Exercises 7 and 8, use a Wilcoxon test to test...Ch. 11 - Prob. 11.3.9RECh. 11 - Prob. 11.3.10RECh. 11 - Prob. 11.4.11RECh. 11 - Prob. 11.4.12RECh. 11 - Prob. 11.5.13RECh. 11 - Prob. 11.5.14RECh. 11 - Prob. 1CQCh. 11 - Prob. 2CQCh. 11 - Prob. 3CQCh. 11 - Prob. 4CQCh. 11 - Prob. 5CQCh. 11 - Prob. 1CTCh. 11 - Prob. 2CTCh. 11 - Prob. 3CTCh. 11 - Prob. 4CTCh. 11 - Prob. 5CTCh. 11 - How Would You Do It? (a) What sampling technique...Ch. 11 - Prob. 2RSRDCh. 11 - Prob. 3RSRDCh. 11 - Prob. 1TCh. 11 - Prob. 2TCh. 11 - Prob. 3TCh. 11 - Prob. 4TCh. 11 - Prob. 5TCh. 11 - Prob. 6T
Knowledge Booster


Learn more about
Need a deep-dive on the concept behind this application? Look no further. Learn more about this topic, statistics and related others by exploring similar questions and additional content below.Recommended textbooks for you
 Functions and Change: A Modeling Approach to Coll...AlgebraISBN:9781337111348Author:Bruce Crauder, Benny Evans, Alan NoellPublisher:Cengage Learning
Functions and Change: A Modeling Approach to Coll...
Algebra
ISBN:9781337111348
Author:Bruce Crauder, Benny Evans, Alan Noell
Publisher:Cengage Learning
The Shape of Data: Distributions: Crash Course Statistics #7; Author: CrashCourse;https://www.youtube.com/watch?v=bPFNxD3Yg6U;License: Standard YouTube License, CC-BY
Shape, Center, and Spread - Module 20.2 (Part 1); Author: Mrmathblog;https://www.youtube.com/watch?v=COaid7O_Gag;License: Standard YouTube License, CC-BY
Shape, Center and Spread; Author: Emily Murdock;https://www.youtube.com/watch?v=_YyW0DSCzpM;License: Standard Youtube License