
Elementary Statistics: Picturing the World (6th Edition)
6th Edition
ISBN: 9780321911216
Author: Ron Larson, Betsy Farber
Publisher: PEARSON
expand_more
expand_more
format_list_bulleted
Videos
Textbook Question
Chapter 11.2, Problem 8E
Performing a Wilcoxon Test In Exercises 3–8,
- (a) identify the claim and state H0 and Ha.
- (b) decide whether to use a Wilcoxon signed-rank test or a Wilcoxon rank sum test.
- (c) find the critical value(s).
- (d) find the test statistic.
- (e) decide whether to reject or fail to reject the null hypothesis.
- (f) interpret the decision in the context of the original claim.
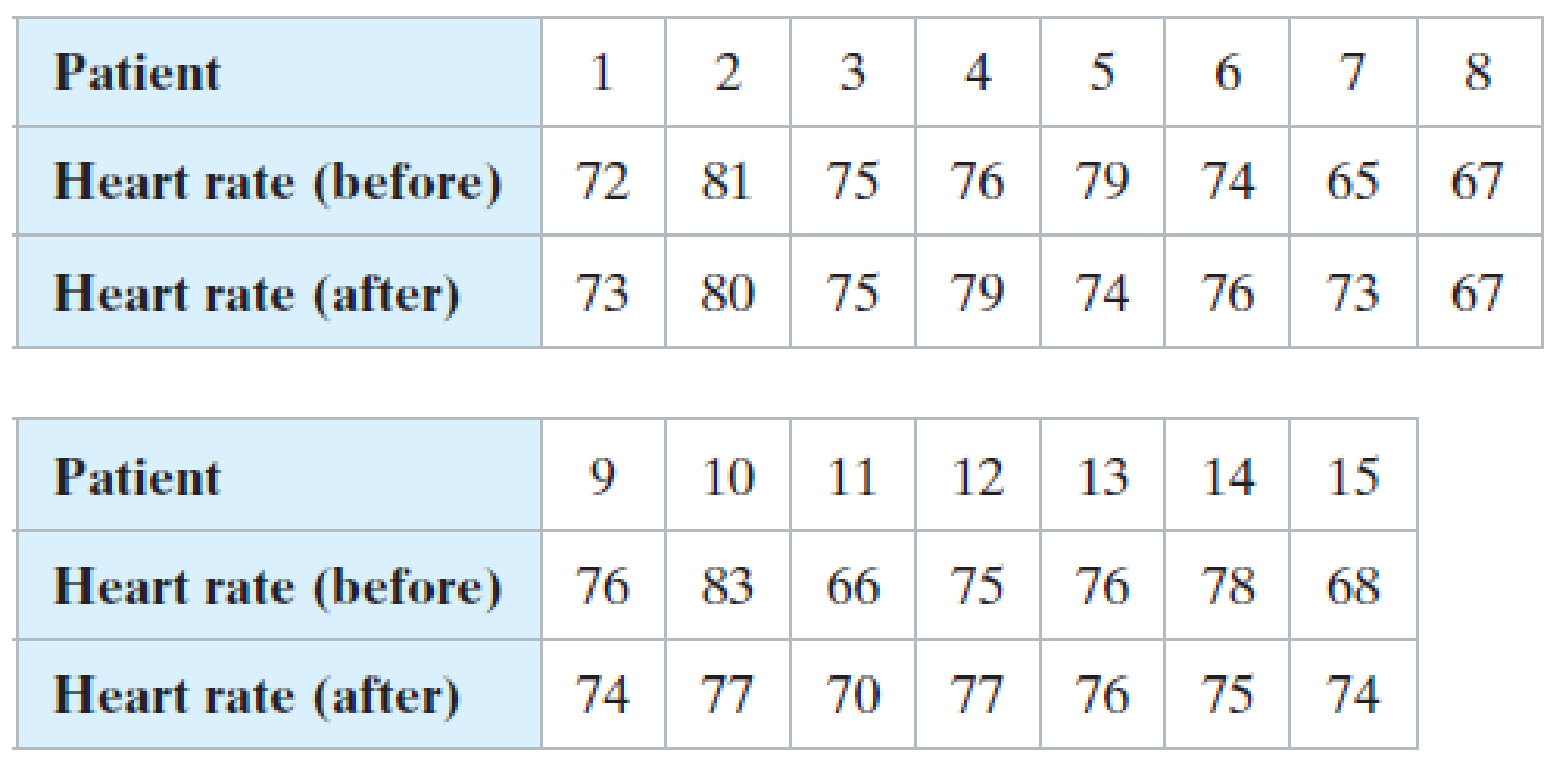
8. Heart Rate A physician wants to determine whether an experimental medication affects an individual’s heart rate. The physician randomly selects 15 patients and measures the heart rate of each. The subjects then take the medication and have their heart rates measured after one hour. The table shows the results. At a = 0.05, can the physician conclude that the experimental medication affects an individual’s heart rate?
Expert Solution & Answer
Want to see the full answer?
Check out a sample textbook solution
Students have asked these similar questions
Testing Claims About Variation. In Exercises 5–16, test the given claim. Identify the null hypothesis, alternative hypothesis, test statistic, P-value, or critical value(s), then state the conclusion about the null hypothesis, as well as the final conclusion that addresses the original claim. Assume that a simple random sample is selected from a normally distributed population.
Bank Lines The Jefferson Valley Bank once had a separate customer waiting line at each teller window, but it now has a single waiting line that feeds the teller windows as vacancies occur. The standard deviation of customer waiting times with the old multiple-line configuration was 1.8 min. Listed below is a simple random sample of waiting times (minutes) with the single waiting line. Use a 0.05 significance level to test the claim that with a single waiting line, the waiting times have a standard deviation less than 1.8 min. What improvement occurred when banks changed from multiple waiting lines to a single…
Testing Hypotheses. In Exercises 13–24, assume that a simple random sample has been selected and test the given claim. Unless specified by your instructor, use either the P-value method or the critical value method for testing hypotheses. Identify the null and alternative hypotheses, test statistic, P-value (or range of P-values), or critical value(s), and state the final conclusion that addresses the original claim.
Lead in Medicine Listed below are the lead concentrations (in μ g/g) measured in different Ayurveda medicines. Ayurveda is a traditional medical system commonly used in India. The lead concentrations listed here are from medicines manufactured in the United States (based on data from “Lead, Mercury, and Arsenic in US and Indian Manufactured Ayurvedic Medicines Sold via the Internet,” by Saper et al., Journal of the American Medical Association, Vol. 300, No. 8). Use a 0.05 significance level to test the claim that the mean lead concentration for all such medicines is…
Testing Hypotheses. In Exercises 13–24, assume that a simple random sample has been selected and test the given claim. Unless specified by your instructor, use either the P-value method or the critical value method for testing hypotheses. Identify the null and alternative hypotheses, test statistic, P-value (or range of P-values), or critical value(s), and state the final conclusion that addresses the original claim.
Heights of Supermodels Listed below are the heights (cm) for the simple random sample of female supermodels Lima, Bundchen, Ambrosio, Ebanks, Iman, Rubik, Kurkova, Kerr, Kroes, Swanepoel, Prinsloo, Hosk, Kloss, Robinson, Heatherton, and Refaeli. Use a 0.01 significance level to test the claim that supermodels have heights with a mean that is greater than the mean height of 162 cm for women in the general population. Given that there are only 16 heights represented, can we really conclude that supermodels are taller than the typical woman?
Chapter 11 Solutions
Elementary Statistics: Picturing the World (6th Edition)
Ch. 11.1 - Prob. 1TYCh. 11.1 - Prob. 2TYCh. 11.1 - Prob. 3TYCh. 11.1 - Prob. 1ECh. 11.1 - When the sign test is used, what population...Ch. 11.1 - Describe the test statistic for the sign test when...Ch. 11.1 - In your own words, explain why the hypothesis test...Ch. 11.1 - Explain how to use the sign test to test a...Ch. 11.1 - List the two conditions that must be met in order...Ch. 11.1 - Prob. 7E
Ch. 11.1 - Temperature A meteorologist claims that the median...Ch. 11.1 - Prob. 9ECh. 11.1 - Temperature During a weather report, a...Ch. 11.1 - Prob. 11ECh. 11.1 - Prob. 12ECh. 11.1 - Prob. 13ECh. 11.1 - Prob. 14ECh. 11.1 - Unit Size A renters organization claims that the...Ch. 11.1 - Prob. 16ECh. 11.1 - Prob. 17ECh. 11.1 - Prob. 18ECh. 11.1 - Prob. 19ECh. 11.1 - Prob. 20ECh. 11.1 - Prob. 21ECh. 11.1 - Prob. 22ECh. 11.1 - Prob. 23ECh. 11.1 - Contacting Parents A research organization...Ch. 11.1 - Prob. 25ECh. 11.1 - Prob. 26ECh. 11.1 - Prob. 27ECh. 11.1 - Ages of Grooms A marriage counselor claims that...Ch. 11.2 - Prob. 1TYCh. 11.2 - Prob. 2TYCh. 11.2 - Prob. 1ECh. 11.2 - Prob. 2ECh. 11.2 - Prob. 3ECh. 11.2 - Prob. 4ECh. 11.2 - Prob. 5ECh. 11.2 - Prob. 6ECh. 11.2 - Prob. 7ECh. 11.2 - Performing a Wilcoxon Test In Exercises 38, (a)...Ch. 11.2 - Wilcoxon Signed-Rank Test for n 30 When you are...Ch. 11.2 - Prob. 10ECh. 11.2 - Prob. 1CSCh. 11.2 - Prob. 2CSCh. 11.2 - Prob. 3CSCh. 11.2 - Prob. 4CSCh. 11.2 - Prob. 5CSCh. 11.2 - Prob. 6CSCh. 11.2 - Prob. 7CSCh. 11.3 - Prob. 1TYCh. 11.3 - Prob. 1ECh. 11.3 - Explain why the Kruskal-Wallis test is always a...Ch. 11.3 - Prob. 3ECh. 11.3 - Prob. 4ECh. 11.3 - Prob. 5ECh. 11.3 - Prob. 6ECh. 11.3 - Comparing Two Tests In Exercises 7 and 8, (a)...Ch. 11.3 - Comparing Two Tests In Exercises 7 and 8, (a)...Ch. 11.4 - Prob. 1TYCh. 11.4 - Prob. 1ECh. 11.4 - Prob. 2ECh. 11.4 - Prob. 3ECh. 11.4 - Prob. 4ECh. 11.4 - Prob. 5ECh. 11.4 - Prob. 6ECh. 11.4 - Prob. 7ECh. 11.4 - Prob. 8ECh. 11.4 - Prob. 9ECh. 11.4 - Prob. 10ECh. 11.4 - Prob. 11ECh. 11.4 - Prob. 12ECh. 11.4 - Prob. 13ECh. 11.4 - Prob. 14ECh. 11.5 - Prob. 1TYCh. 11.5 - Prob. 2TYCh. 11.5 - Prob. 3TYCh. 11.5 - In your own words, explain why the hypothesis test...Ch. 11.5 - Describe the test statistic for the runs test when...Ch. 11.5 - Finding the Number of Runs In Exercises 36,...Ch. 11.5 - Prob. 4ECh. 11.5 - Finding the Number of Runs In Exercises 36,...Ch. 11.5 - Prob. 6ECh. 11.5 - Prob. 7ECh. 11.5 - Prob. 8ECh. 11.5 - Prob. 9ECh. 11.5 - Prob. 10ECh. 11.5 - Finding Critical Values In Exercises 1114, use the...Ch. 11.5 - Prob. 12ECh. 11.5 - Prob. 13ECh. 11.5 - Prob. 14ECh. 11.5 - Prob. 15ECh. 11.5 - Prob. 16ECh. 11.5 - Prob. 17ECh. 11.5 - Prob. 18ECh. 11.5 - Prob. 19ECh. 11.5 - Prob. 20ECh. 11.5 - Prob. 21ECh. 11.5 - Prob. 22ECh. 11.5 - Runs Test with Quantitative Data In Exercises...Ch. 11 - Using an Inappropriate Test Discuss the...Ch. 11 - Prob. 11.1.1RECh. 11 - Prob. 11.1.2RECh. 11 - Prob. 11.1.3RECh. 11 - Prob. 11.1.4RECh. 11 - Prob. 11.1.5RECh. 11 - Prob. 11.1.6RECh. 11 - Prob. 11.2.7RECh. 11 - In Exercises 7 and 8, use a Wilcoxon test to test...Ch. 11 - Prob. 11.3.9RECh. 11 - Prob. 11.3.10RECh. 11 - Prob. 11.4.11RECh. 11 - Prob. 11.4.12RECh. 11 - Prob. 11.5.13RECh. 11 - Prob. 11.5.14RECh. 11 - Prob. 1CQCh. 11 - Prob. 2CQCh. 11 - Prob. 3CQCh. 11 - Prob. 4CQCh. 11 - Prob. 5CQCh. 11 - Prob. 1CTCh. 11 - Prob. 2CTCh. 11 - Prob. 3CTCh. 11 - Prob. 4CTCh. 11 - Prob. 5CTCh. 11 - How Would You Do It? (a) What sampling technique...Ch. 11 - Prob. 2RSRDCh. 11 - Prob. 3RSRDCh. 11 - Prob. 1TCh. 11 - Prob. 2TCh. 11 - Prob. 3TCh. 11 - Prob. 4TCh. 11 - Prob. 5TCh. 11 - Prob. 6T
Knowledge Booster


Learn more about
Need a deep-dive on the concept behind this application? Look no further. Learn more about this topic, statistics and related others by exploring similar questions and additional content below.Similar questions
- Testing the hypothesis using Sign test, Wilcoxan Test Statistic and t-testarrow_forwarda. Find the expected frequencies. b. Determine the critical value, x^2 0, and the rejection region. c. Calculate the test statistic. (d) Decide whether to reject or fail to reject the null hypothesis. Then interpret the decision in the context of the original claim.arrow_forwardTesting Claims About Variation. In Exercises 5–16, test the given claim. Identify the null hypothesis, alternative hypothesis, test statistic, P-value, or critical value(s), then state the conclusion about the null hypothesis, as well as the final conclusion that addresses the original claim. Assume that a simple random sample is selected from a normally distributed population. Fast Food Drive-Through Service Times Listed below are drive-through service times (seconds) recorded at McDonald’s during dinner times (from Data Set 25 “Fast Food” in Appendix B). Assuming that dinner service times at Wendy’s have standard deviation σ = 55.93 sec, use a 0.01 significance level to test the claim that service times at McDonald’s have the same variation as service times at Wendy’s. Should McDonald’s take any action?arrow_forward
- Testing Claims About Variation. In Exercises 5–16, test the given claim. Identify the null hypothesis, alternative hypothesis, test statistic, P-value, or critical value(s), then state the conclusion about the null hypothesis, as well as the final conclusion that addresses the original claim. Assume that a simple random sample is selected from a normally distributed population. Pulse Rates of Women Repeat the preceding exercise using the pulse rates of women listed in Data Set 1 “Body Data” in Appendix B. For the sample of pulse rates of women, n = 147 and s = 12.5. See the accompanying JMP display that results from using the original list of pulse rates instead of the summary statistics. (Hint: The bottom three rows of the display provide P -values for a two-tailed test, a left-tailed test, and a right-tailed test, respectively.) What do the results indicate about the effectiveness of using the range rule of thumb with the “normal range” from 60 to 100 beats per minute for estimating…arrow_forwardTesting Claims About Variation. In Exercises 5–16, test the given claim. Identify the null hypothesis, alternative hypothesis, test statistic, P-value, or critical value(s), then state the conclusion about the null hypothesis, as well as the final conclusion that addresses the original claim. Assume that a simple random sample is selected from a normally distributed population. Mint Specs Listed below are weights (grams) from a simple random sample of “wheat” pennies (from Data Set 29 “Coin Weights” in Appendix B). U.S. Mint specifications now require a standard deviation of 0.0230 g for weights of pennies. Use a 0.01 significance level to test the claim that wheat pennies are manufactured so that their weights have a standard deviation equal to 0.0230 g. Does the Mint specification appear to be met?arrow_forwardTesting Claims About Variation. In Exercises 5–16, test the given claim. Identify the null hypothesis, alternative hypothesis, test statistic, P-value, or critical value(s), then state the conclusion about the null hypothesis, as well as the final conclusion that addresses the original claim. Assume that a simple random sample is selected from a normally distributed population. Body Temperature Example 5 in Section 8-3 involved a test of the claim that humans have body temperatures with a mean equal to 98.6°F. The sample of 106 body temperatures has a standard deviation of 0.62°F. The conclusion in that example would change if the sample standard deviation s were 2.08°F or greater. Use a 0.01 significance level to test the claim that the sample of 106 body temperatures is from a population with a standard deviation less than 2.08°F. What does the result tell us about the validity of the hypothesis test in Example 5 in Section 8-3?arrow_forward
- A) Use the moment-generating function to calculate the first moment u1 B) A) Use the moment-generating function to calculate the first moment u2 C)What is the mean and variance of the random variable Yarrow_forwardWilcoxon Mann-Whitney Test Cities: Munoz and Cabanatuanarrow_forwardTesting Claims About Variation. In Exercises 5–16, test the given claim. Identify the null hypothesis, alternative hypothesis, test statistic, P-value, or critical value(s), then state the conclusion about the null hypothesis, as well as the final conclusion that addresses the original claim. Assume that a simple random sample is selected from a normally distributed population. Aircraft Altimeters The Skytek Avionics company uses a new production method to manufacture aircraft altimeters. A simple random sample of new altimeters resulted in the errors listed below. Use a 0.05 level of significance to test the claim that the new production method has errors with a standard deviation greater than 32.2 ft, which was the standard deviation for the old production method. If it appears that the standard deviation is greater, does the new production method appear to be better or worse than the old method? Should the company take any action?arrow_forward
- PDF x P(X =x) x * P(X=x) 0 0.1 0 1 0.2 0.2 2 0.3 0.6 3 0.4 1.2 Find the expected value: ?arrow_forwarda) State the null and alternative hypothesisb) Determine the critical value by using t-tablec) Determine the rejection regiond) Calculate the Test statisticarrow_forwardIdentify the claim and state Ho and H Determine whether the hypothesis test is left-tailed, right-tailed, or two-tailed, and whether to use a z-test, a t-test, or a chi-square test. Explain your reasoning. Find the critical value(s), identify the rejection region(s), and find the appropriate standardized test statistic. Decide whether to reject or fail to reject the null hypothesis. Interpret the decision in the context of the original claim. A tourist agency in Nevada claims the mean daily cost of meals and lodging for two adults traveling in the state is more than $300. You work for a consumer protection advocate and want to test this claim. In a random sample 35 pairs of adults traveling in Nevada, the mean daily cost of meals and lodging is $316. Assume the population standard deviation is $30. At α = 0.10, do you have enough evidence to support the agency’s claim?arrow_forward
arrow_back_ios
SEE MORE QUESTIONS
arrow_forward_ios
Recommended textbooks for you
 MATLAB: An Introduction with ApplicationsStatisticsISBN:9781119256830Author:Amos GilatPublisher:John Wiley & Sons Inc
 Probability and Statistics for Engineering and th...StatisticsISBN:9781305251809Author:Jay L. DevorePublisher:Cengage Learning
 Statistics for The Behavioral Sciences (MindTap C...StatisticsISBN:9781305504912Author:Frederick J Gravetter, Larry B. WallnauPublisher:Cengage Learning
 Elementary Statistics: Picturing the World (7th E...StatisticsISBN:9780134683416Author:Ron Larson, Betsy FarberPublisher:PEARSON
 The Basic Practice of StatisticsStatisticsISBN:9781319042578Author:David S. Moore, William I. Notz, Michael A. FlignerPublisher:W. H. Freeman
 Introduction to the Practice of StatisticsStatisticsISBN:9781319013387Author:David S. Moore, George P. McCabe, Bruce A. CraigPublisher:W. H. Freeman
MATLAB: An Introduction with Applications
Statistics
ISBN:9781119256830
Author:Amos Gilat
Publisher:John Wiley & Sons Inc
Probability and Statistics for Engineering and th...
Statistics
ISBN:9781305251809
Author:Jay L. Devore
Publisher:Cengage Learning
Statistics for The Behavioral Sciences (MindTap C...
Statistics
ISBN:9781305504912
Author:Frederick J Gravetter, Larry B. Wallnau
Publisher:Cengage Learning
Elementary Statistics: Picturing the World (7th E...
Statistics
ISBN:9780134683416
Author:Ron Larson, Betsy Farber
Publisher:PEARSON
The Basic Practice of Statistics
Statistics
ISBN:9781319042578
Author:David S. Moore, William I. Notz, Michael A. Fligner
Publisher:W. H. Freeman
Introduction to the Practice of Statistics
Statistics
ISBN:9781319013387
Author:David S. Moore, George P. McCabe, Bruce A. Craig
Publisher:W. H. Freeman
Type I and II Errors, Power, Effect Size, Significance and Power Analysis in Quantitative Research; Author: NurseKillam;https://www.youtube.com/watch?v=OWn3Ko1WYTA;License: Standard YouTube License, CC-BY