
Concept explainers
Videos
Consider the following pairs of observations:
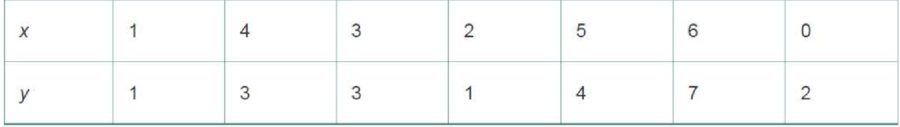
a. Construct a scatterplot for the data.
b. Use the method of least squares to fit a straight line to the seven data points in the table.
c. Plot the least squares line on your scatterplot of part a.
d. Specify the null and alternative hypotheses you would use to test whether the data provide sufficient evidence to indicate that x contributes information for the (linear) prediction of y.
e. What is the test statistic that should be used in conducting the hypothesis test of part d? Specify the degrees of freedom associated with the test statistic.
f. Conduct the hypothesis test of part d using α = .05.

Trending nowThis is a popular solution!

Chapter 11 Solutions
Statistics for Business and Economics, Student Value Edition (13th Edition)


 Linear Algebra: A Modern IntroductionAlgebraISBN:9781285463247Author:David PoolePublisher:Cengage Learning
 Big Ideas Math A Bridge To Success Algebra 1: Stu...AlgebraISBN:9781680331141Author:HOUGHTON MIFFLIN HARCOURTPublisher:Houghton Mifflin Harcourt