
Videos
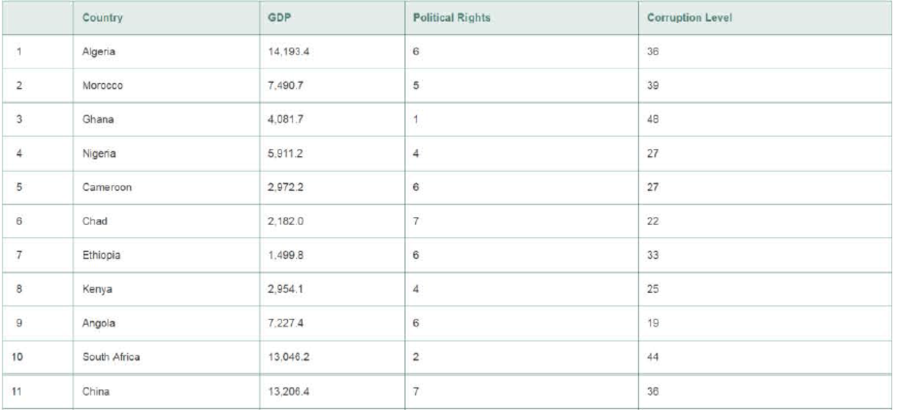
Management research In Africa. The editors of the Academy of Management Journal (April 2016) called for expanding management-related research of African countries by noting the diversity of the countries. They illustrated this diversity by comparing a sample of 10 African countries with China. Germany. and the United States on several variables. The three variables shown in the table (top of next column) are Gross Domestic Product (GOP) per capita, degree of freedom in political rights (measured on a 7-point scale, where “1” indicates the greatest degree and “7” the smallest degree). and level of government corruption (measured on a 100-point scale, where “0” indicates the highest level of corruption and “100” indicates the country is free of corruption). Consider a model for corruption level (y) of a country.
- a. Conduct a complete simple linear
regression analysis to evaluate GOP per capita (x) as a linear predictor of corruption level (y). - b. Conduct a complete simple linear regression analysis to evaluate degree of freedom in political rights (x) as a linear predictor of corruption level (y).
- c. Based on the results, parts a and b, what inferences can you make about the nature of the relationship each x has with corruption level (y)?

Want to see the full answer?
Check out a sample textbook solution
Chapter 11 Solutions
MyLab Statistics for Business Stats with Pearson eText -- Standalone Access Card -- for Statistics for Business and Economics


- What is meant by the sample space of an experiment?arrow_forwardUrban Travel Times Population of cities and driving times are related, as shown in the accompanying table, which shows the 1960 population N, in thousands, for several cities, together with the average time T, in minutes, sent by residents driving to work. City Population N Driving time T Los Angeles 6489 16.8 Pittsburgh 1804 12.6 Washington 1808 14.3 Hutchinson 38 6.1 Nashville 347 10.8 Tallahassee 48 7.3 An analysis of these data, along with data from 17 other cities in the United States and Canada, led to a power model of average driving time as a function of population. a Construct a power model of driving time in minutes as a function of population measured in thousands b Is average driving time in Pittsburgh more or less than would be expected from its population? c If you wish to move to a smaller city to reduce your average driving time to work by 25, how much smaller should the city be?arrow_forward
 Functions and Change: A Modeling Approach to Coll...AlgebraISBN:9781337111348Author:Bruce Crauder, Benny Evans, Alan NoellPublisher:Cengage Learning
 Glencoe Algebra 1, Student Edition, 9780079039897...AlgebraISBN:9780079039897Author:CarterPublisher:McGraw Hill
 Big Ideas Math A Bridge To Success Algebra 1: Stu...AlgebraISBN:9781680331141Author:HOUGHTON MIFFLIN HARCOURTPublisher:Houghton Mifflin Harcourt
 Holt Mcdougal Larson Pre-algebra: Student Edition...AlgebraISBN:9780547587776Author:HOLT MCDOUGALPublisher:HOLT MCDOUGAL
 College Algebra (MindTap Course List)AlgebraISBN:9781305652231Author:R. David Gustafson, Jeff HughesPublisher:Cengage Learning