
Videos
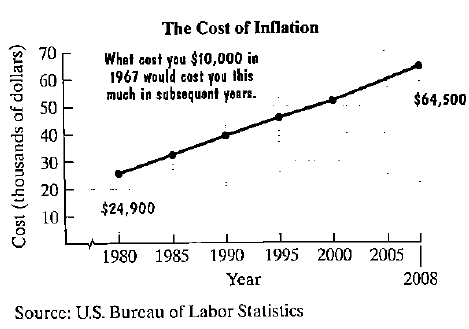
The line graph shows the cost of inflation. What cost $10,000 in 1967 would cost the amount shown by the graph in subsequent years. (The symbol  on the horizontal axis shows that there is a break in values between 0 and 80. Thus, the first tick mark on the horizontal axis represents 1980.)
Here are two mathematical models for the data shown by the graph. In each formula, C represents the cost x years after 1980 of what cost $10,000 in 1967.
Use these models to solve Exercises 99-102.
a. Use the graph to estimate the cost in 1990, to the nearest thousand dollars, of what cost $10,000 in 1967.
b. Use model 1 to determine the cost in 1900. How well does this describe your estimate from part (a)?
c. Use model 2 to determine the cost in 1990. How well does this describe your estimate from part (a)?
Want to see the full answer?
Check out a sample textbook solution
Chapter 1 Solutions
College Algebra (Looseleaf) - With Access


- Table 3 gives the annual sales (in millions of dollars) of a product from 1998 to 20006. What was the average rate of change of annual sales (a) between 2001 and 2002, and (b) between 2001 and 2004?arrow_forwardThe average number of weekly social media posts varies jointly with the poster's yearly income (in thousands) and inversely with their age in years. If a 60-year-old person with an income of $100,000 posts an average of 300 times in a week, what is the value of k?arrow_forwardA store shows a net profit of $65,250 for the year. If the store profit increases by 3.75% per year for the next 15 years what will the net profit be at that point?arrow_forward
- A network server has an original value of 10, 000 and is to be depreciated linearly over 5 years with a 3000 scrap value. Find an expression giving the book value at the end of year t . What will be the book value of the server at the end of the second year? What is the rate of depreciation of the server?arrow_forwardwrite a linear equation for this: "Baden, the health authority's chief financial officer stood by the veracity of that initial timeline Wednesday. He said state officials were hoping to see 200,000 to 250,000 first doses administered per week."arrow_forward1. Make a scatter plot of the table provided in the image. B. Write a linear/exponential equation that models this table provided in the image. C. Explain what the slope/multiplier means in the context of the problem. E. Use your model to predict when there will be 100 new casesarrow_forward
- 3. Determine if the data is linear or exponential and find a function that models the data: -4 -2 0. 2 4 y 0.625 2.5 10 40 160arrow_forwardThe price of a commodity increased by 5% from 1978 to 1979, by 8% from 1979 to 1980 and by 77% from 1980 to 1981. Find the average rate of change.arrow_forwardThe line graph shows the cost of inflation. The graph shows subsequent years from 1982, comparing what $10,000 bought in 1982, to what it would buy in the years shown. There are two possible mathematical functions for the data.arrow_forward
- Suppose the value of your car is decreasing by 18% per year. If your car is currently worth $20,000. What will it be worth in three years? Round to the nearest cent.arrow_forwardIf the price of gasoline increased by 20% one week and then again by 10% the following week by what % did it increase in the two week period?arrow_forwardhow long does it take an account containing $8000 to be worth $15000 if the money is invested at 9% conpounded monthly?arrow_forward
 College AlgebraAlgebraISBN:9781305115545Author:James Stewart, Lothar Redlin, Saleem WatsonPublisher:Cengage Learning
 Intermediate AlgebraAlgebraISBN:9781285195728Author:Jerome E. Kaufmann, Karen L. SchwittersPublisher:Cengage Learning
 Trigonometry (MindTap Course List)TrigonometryISBN:9781337278461Author:Ron LarsonPublisher:Cengage Learning
 Glencoe Algebra 1, Student Edition, 9780079039897...AlgebraISBN:9780079039897Author:CarterPublisher:McGraw Hill