
Videos
Application Exercises
In the year after warning labels were put on cigarette pack, the number of smokers dropped from approximately two in five adults to one in five. The bar graph shows the percentage of American adults who smoked cigarettes for selected years from 1970. Through 2010.
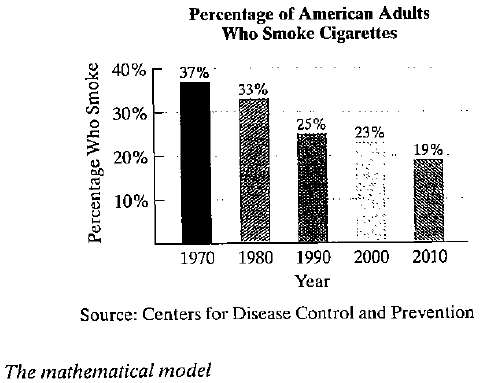
The Mathematical model
describes the percentage of Americans who smoked cigarettes, p, x years after 1970. Use this model to solve Exercises 97–98.
a. Does the mathematical model underestimate or overestimate the percentage of American adults who smoked cigarettes in 2010? By how much?
b. Use the mathematical model to project the year when only 7% of American adults will smoke cigarettes.
Want to see the full answer?
Check out a sample textbook solution
Chapter 1 Solutions
College Algebra (Looseleaf) - With Access
Additional Math Textbook Solutions
Beginning and Intermediate Algebra
College Algebra Essentials
Elementary & Intermediate Algebra
Elementary Algebra For College Students (10th Edition)
Elementary Algebra: Concepts and Applications (10th Edition)


- Solve the variation problems in Exercises 68–73. 68. A company's profit varies directly as the number of products it sells. The company makes a profit of $1175 on the sale of 25 products. What is the company's profit when it sells 105 products? 69. The distance that a body falls from rest varies directly as the square of the time of the fall. If skydivers fall 144 feet in 3 seconds, how far will they fall in 10 seconds? 70. The pitch of a musical tone varies inversely as its wavelength. A tone has a pitch of 660 vibrations per second and a wavelength of 1.6 feet. What is the pitch of a tone that has a wavelength of 2.4 feet? 71. The loudness of a stereo speaker, measured in decibels, varies inversely as the square of your distance from the speaker. When you are 8 feet from the speaker, the loudness is 28 decibels. What is the loudness when you are 4 feet from the speaker? 72. The time required to assemble computers varies directly as the number of computers assembled and inversely as…arrow_forwardExercises 93–94: Energy The following graph shows U.S. Energy consumption. 400 350 300 250 200 150 100 50 04 1970 1990 2010 Year 93. When was energy consumption increasing? 94. When was energy consumption decreasing? Energy (millions of Btu)arrow_forwardIn Exercises 41–48, write a piecewise formula for the function.arrow_forward
- The average amount A (in pounds per person) of fish and shellfish consumed in the UnitedStates during the period 1992–2001 can be modeled by A = (3.2x + 260)/(52x + 3800) where x is the number of years since 1992.Rewrite the model so that it has only whole number coefficients. Then simplify the model.arrow_forwardInsurance Rates The following table gives themonthly insurance rates for a $100,000 life insurancepolicy for smokers 35–50 years of age.a. Create a scatter plot for the data.b. Does it appear that a quadratic function can beused to model the data? If so, find the best-fittingquadratic model.c. Find the power model that is the best fit for the data.d. Compare the two models by graphing each modelon the same axes with the data points. Whichmodel appears to be the better fit?arrow_forwardUse this information to solve Exercises 9–11:A company is planning to produce and sell a new line of computers. The fixed cost will be $360,000 and it will cost $850 to produce each computer. Each computer will be sold for $1150. 9. Write the cost function, C, of producing x computers. 10. Write the revenue function, R, from the sale of x computers. 11. Determine the break-even point. Describe what this means.arrow_forward
- Exercise 2.2arrow_forwardWorld Military Expenditure The following chart shows total military and arms trade expenditure from 2011–2020 (t = 1 represents 2011). †A bar graph titled "World military expenditure" has a horizontal t-axis labeled "Year since 2010" and a vertical axis labeled "$ (billions)". The bar graph has 10 bars. Each bar is associated with a label and an approximate value as listed below. 1: 1,800 billion dollars 2: 1,775 billion dollars 3: 1,750 billion dollars 4: 1,730 billion dollars 5: 1,760 billion dollars 6: 1,760 billion dollars 7: 1,850 billion dollars 8: 1,900 billion dollars 9: 1,950 billion dollars 10: 1,980 billion dollars (a) If you want to model the expenditure figures with a function of the form f(t) = at2 + bt + c, would you expect the coefficient a to be positive or negative? Why? HINT [See "Features of a Parabola" in this section.] We would expect the coefficient to be positive because the curve is concave up. We would expect the coefficient to be negative because the…arrow_forwardPart 4: g(-1)=arrow_forward
 Algebra & Trigonometry with Analytic GeometryAlgebraISBN:9781133382119Author:SwokowskiPublisher:Cengage