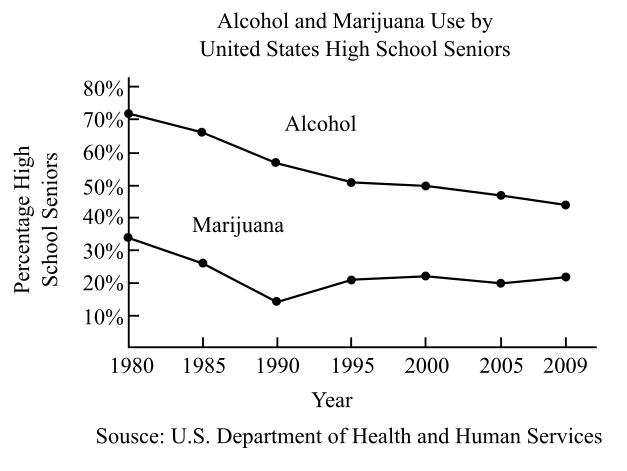
The percentage of seniors who used marijuana in 2005 with the help of the appropriate line graph:
(b)
To determine
To calculate: The percentage of seniors who used marijuana in 2005 with the help of the mathematical model M=−0.3n+27. Also, determine whether it overestimate or underestimate the value displayed by the graph and by how much.
(c)
To determine
The percentage of seniors who used alcohol in 2005 with the help of the appropriate line graph:
(d)
To determine
To calculate: The percentage of seniors who used alcohol in 2005 with the help of the mathematical model A=−0.9n+69. Also, determine whether it overestimate or underestimate the value displayed by the graph and by how much.
(e)
To determine
In which year marijuana is used minimum by seniors from the period 1980 to 2009.
Need a deep-dive on the concept behind this application? Look no further. Learn more about this topic, algebra and related others by exploring similar questions and additional content below.
Compound Interest Formula Explained, Investment, Monthly & Continuously, Word Problems, Algebra; Author: The Organic Chemistry Tutor;https://www.youtube.com/watch?v=P182Abv3fOk;License: Standard YouTube License, CC-BY
Applications of Algebra (Digit, Age, Work, Clock, Mixture and Rate Problems); Author: EngineerProf PH;https://www.youtube.com/watch?v=Y8aJ_wYCS2g;License: Standard YouTube License, CC-BY


 Algebra and Trigonometry (6th Edition)AlgebraISBN:9780134463216Author:Robert F. BlitzerPublisher:PEARSON
 Contemporary Abstract AlgebraAlgebraISBN:9781305657960Author:Joseph GallianPublisher:Cengage Learning
 Linear Algebra: A Modern IntroductionAlgebraISBN:9781285463247Author:David PoolePublisher:Cengage Learning
 Algebra And Trigonometry (11th Edition)AlgebraISBN:9780135163078Author:Michael SullivanPublisher:PEARSON
 Introduction to Linear Algebra, Fifth EditionAlgebraISBN:9780980232776Author:Gilbert StrangPublisher:Wellesley-Cambridge Press
 College Algebra (Collegiate Math)AlgebraISBN:9780077836344Author:Julie Miller, Donna GerkenPublisher:McGraw-Hill Education