
Traffic And Highway Engineering
5th Edition
ISBN: 9781133605157
Author: Garber, Nicholas J., Hoel, Lester A.
Publisher: Cengage Learning,
expand_more
expand_more
format_list_bulleted
Concept explainers
Videos
Textbook Question
Chapter 12, Problem 10P
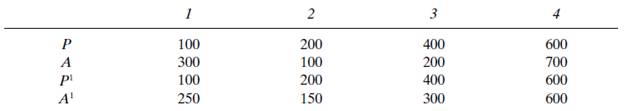
Given a table with production and attraction data, determine the number of productions and attractions that should be used for each zone in the second iteration.
Expert Solution & Answer
Want to see the full answer?
Check out a sample textbook solution
Students have asked these similar questions
In a survey in the base year, the trip attraction, number of employees and shopping area in the zones are found
as follows:
Zone
1
2
3
4
5
6
7
8
9
10
Trip attraction
(Trips/day)
34,000
33,000
37,000
9,000
19,000
20,000
50,000
22,000
21,000
5,000
Number of employees
(persons)
2000
1500
3000
500
1000
1000
3200
1800
1600
200
Shopping area (m²)
250,000
350,000
150,000
80,000
160,000
180,000
350,000
60,000
100,000
50,000
Prepare a excel worksheet to calculate the generation model by regression analysis.
The following table shows the productions and attractions used in the first iteration of a trip distribution procedure andthe productions and attractions that resulted. Determine the number of productions and attractions that should be usedfor each zone in the second iteration.
Use a weighted unit cost to determine the conceptual cost estimate for a proposed parking that is to contain 350 stored cars. Previous project data is given in the table.
Chapter 12 Solutions
Traffic And Highway Engineering
Ch. 12 - Prob. 1PCh. 12 - Prob. 2PCh. 12 - Prob. 3PCh. 12 - Prob. 4PCh. 12 - Prob. 5PCh. 12 - Prob. 6PCh. 12 - Prob. 7PCh. 12 - Prob. 8PCh. 12 - Prob. 9PCh. 12 - Given a table with production and attraction data,...
Ch. 12 - Given a table with production and attraction data,...Ch. 12 - Prob. 12PCh. 12 - Prob. 13PCh. 12 - Prob. 14PCh. 12 - Prob. 15PCh. 12 - Prob. 16PCh. 12 - Prob. 17PCh. 12 - Prob. 18PCh. 12 - Prob. 19PCh. 12 - Prob. 20PCh. 12 - Prob. 21PCh. 12 - Prob. 22PCh. 12 - Prob. 23PCh. 12 - Prob. 24PCh. 12 - Prob. 25PCh. 12 - Prob. 26PCh. 12 - Prob. 27PCh. 12 - Prob. 28P
Knowledge Booster


Learn more about
Need a deep-dive on the concept behind this application? Look no further. Learn more about this topic, civil-engineering and related others by exploring similar questions and additional content below.Similar questions
- A small town has been divided into three traffic zones. An origin-destination survey was conducted earlier this year and yielded the number of trips between each zone as shown in the table below. Travel times between zones were also determined. Provide a trip dis- tribution calculation using the gravity model for two iterations. Assume K; = 1. The following table shows the number of productions and attractions in each zone. Zone 1 2 3 Total Productions 250 450 300 1000 Attractions 395 180 425 1000 The survey's results for the zones' travel time in minutes were as follows. Zone 1 3 1 6 4 2 2 8 3 3 1 3 The following table shows travel time versus friction factor. Time (min) 1 2 4 7 8 Friction Factor 82 52 50 41 39 26 20 13 2.arrow_forwardA developer is building a 60-unit apartment building. Construction will take 15 months covering all of Year 0 and the first 3 months of Year 1. Tenants will begin moving in the first day of Month 4. Lease up is expected to occur at a rate of 10 units per month until reaching full (100%) occupancy (e.g., 10 units occupied in Month 4, 20 units occupied in Month 5, etc.) What forecasted vacancy rate (average vacancy for the year) should be used for Year 1 in the pro forma? Assume 100% occupancy once fully leased up. (CAUTION: The question asks for the VACANCY percent, NOT occupancy percent.) (%)arrow_forwardThe required total period for project completion and the critical path is determined after calculating the values in the empty boxes as in the symbol attached to the drawingarrow_forward
- Calculate the levels of these points (with an audit of calculations)arrow_forwardAnswer also given please show the work clearly. Note: kindly answer all otherwise leave it question. Thank you a What is the probability that path A-B-D-F-G will take from 100 to 120 days to complete? Answer = 40.2% b. What is the probability that path A-C-E-G will take less than 85 days to complete? Answer = 32.64% c. If the contract for the above project is 120 days, what is the chance of meeting the schedule? Answer = 86.3% d. What duration (number of full days) should be used to be at least 90% confident of finishing on time? Answer = 125 days - Probability of 93%arrow_forwardCONSTRUCTION METHOD AND PROJECT MANAGEMENT 3. The owner of a shopping center is considering modernizing and expanding the current 32-business shopping complex. He hopes to add 8 to 10 new business or tenants to the shopping complex. The specific activities that make up the expansion project, together with information on immediate predecessor and completion time, are listed in the following table. (a) What is the total completion time of the project? (b) What are the scheduled start and completion time for each activity? (c) Which activities are critical and must be completed exactly as scheduled in order to keep the project on schedule? (d) How long can the non-critical activities to be delayed before they cause a delay in the completion time for project? Time (days) Activity A B C D E F G H I Immediate Predecessor A A A E D, F B, C G, H po Completion Time (Weeks) 5 6 4 133 3 1 4 14 12 2arrow_forward
- A study area consists of three zones. The data have been determined as shown in the following tables. Zone Productions and Attractions Zone 1 2 3 Total Trip Productions 140 330 280 750 Trip Attractions 300 270 180 750 Travel Time between zones (min) Zone 1 3 1 5 3 2 3 3 5 Travel Time versus Friction Factor Time (min) F 1 82 2 52 3 50 4 41 5 39 6 26 7 20 8 12 Determine the number of trips between each zone using the gravity model. Show all steps in the calculation of friction factors and iterations for balancing attractions and productions. 6.arrow_forwardThe following table shows the productions and attractions used in the first iteration of a trip distribution procedure and the productions and the productions and attractions that resulted. Determine the number of productions and attractions that should be used for each zone in the second iteration.arrow_forwardQ3 / Find the critical path and (Es, EF, Lf, TF) for the activities of the project and determine the total project duration if you have the following information )5٠ درجة( Activity Duration 1-2 2-3 4 2-4 2-5 6. 3-5 3-6 4-5 4-7 3 5-8 7 6-8 6-9 7-8 7-10 5 8-10 9-10 4arrow_forward
- For one of the construction projects, draw the (PERT) network diagram and find the following: What is the probability of completion of the project in 17.5 months? Duration (month) b Actv. a 5-10 2 4 6. 5-15 4 9. 10-20 4 4 7 10-25 10-30 4 6. 15-25 3.5 5.5 7.5 15-30 3 6. 6. 20-35 6. 9. 12 25-35 5 8. 30-35arrow_forwardQ #3. Draw bar chart for activities for a house construction projectarrow_forwardCalculate the total duration and identify the critical path for the projectarrow_forward
arrow_back_ios
SEE MORE QUESTIONS
arrow_forward_ios
Recommended textbooks for you
 Traffic and Highway EngineeringCivil EngineeringISBN:9781305156241Author:Garber, Nicholas J.Publisher:Cengage Learning
 Fundamentals Of Construction EstimatingCivil EngineeringISBN:9781337399395Author:Pratt, David J.Publisher:Cengage,
Traffic and Highway Engineering
Civil Engineering
ISBN:9781305156241
Author:Garber, Nicholas J.
Publisher:Cengage Learning
Fundamentals Of Construction Estimating
Civil Engineering
ISBN:9781337399395
Author:Pratt, David J.
Publisher:Cengage,
What Is A Construction Takeoff? | Are They Still Necessary In Quantity Surveying?; Author: Metroun Quantity Surveying;https://www.youtube.com/watch?v=uTWoDPtcOjg;License: Standard Youtube License