
STATISTICAL TECH IN BUSN LLW/CONNECT
18th Edition
ISBN: 9781264293629
Author: Lind
Publisher: MCG
expand_more
expand_more
format_list_bulleted
Videos
Textbook Question
Chapter 12, Problem 12E
The following are six observations collected from treatment 1, ten observations collected from treatment 2, and eight observations collected from treatment 3. Test the hypothesis that the treatment means are equal at the .05 significance level.
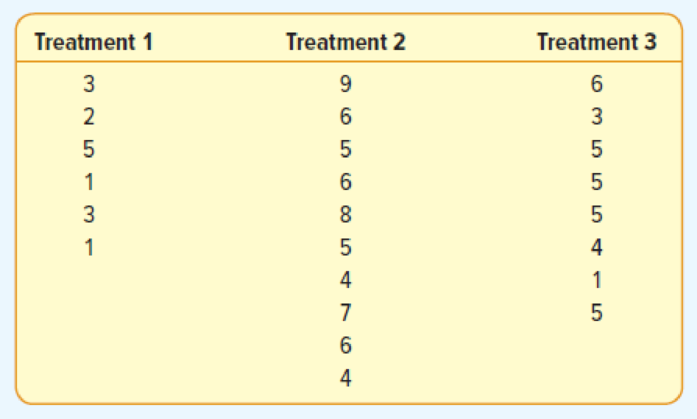
- a. State the null hypothesis and the alternate hypothesis.
- b. What is the decision rule?
- c. Compute SST, SSE, and SS total.
- d. Complete an ANOVA table.
- e. State your decision regarding the null hypothesis.
- f. If H0 is rejected, can we conclude that treatment 2 and treatment 3 differ? Use the 95% level of confidence.
Expert Solution & Answer
Want to see the full answer?
Check out a sample textbook solution
Students have asked these similar questions
A professor wanted to determine if the GPAS of students at Saddleback College are less consistent than the GPAS of students at
Irvine Valley College. To test this, he obtains random samples of students from both colleges and records their GPAS, which are
given below. Test the professor's claim at the a=0.05 level of significance.
Saddleback College
Irvine Valley College
3.7
3.2 3.0
2.5
2.7
3.6 4.0 3.4
3.8
3.2 3.0
2.5
3.6
2.8
2.6
2.5
2.1
2.7
3.9
3.4
2.0
2.2 2.7 3.1
2.0 2.0
2.1
3.8
3.1
2.9
3.2
2.8
Calculator Function
[ Select]
[ Select]
2-PropZTest
ANOVA
X^2-Test
T-Test
2-SampTTest
2-SampFTest
[ Select]
v sufficient evidence that the standard deviation of grades for Saddleback College students is
[ Select]
than the standard deviation for Irvine Valley College students.
Tourism is extremely important to the economy of Florida. Hotel occupancy is an often-reported measure of visitor volume and visitor activity
(Orlando Sentinel, May 19, 2018). Hotel occupancy data for February in two consecutive years are as follows.
Current Year
1,394
1,700
Occupied Rooms
Total Rooms
a. Formulate the hypothesis test that can be used to determine whether there has been an increase in the proportion of rooms occupied over the
one-year period.
Let p₁ = population proportion of rooms occupied for current year
P2 = population proportion of rooms occupied for previous year
0.82
Previous Year
1,404
1,800
Ho: P1 P2 less than or equal to 0
Ha P₁ P2 greater than 0
b. What is the estimated proportion of hotel rooms occupied each year (to 2 decimals)?
Current year
Previous Year
c. Conduct a hypothesis test. What is the p-value (to 4 decimals)? Use Table 1 from Appendix B.
0.78
Given the accompanying null hypothesis, alternative hypothesis, and sample information, complete parts a and b below.
Sample 2
n, = 21
Sample 1
n, = 11
HA
s = 1,468
s5 = 1,303
a. If a = 0.01, state the decision rule for the hypothesis.
(Round to two decimal places as needed.)
O A. If the calculated test statistic F=
reject Ho, otherwise do not reject Ho
O B. If the calculated test statistic F, reject Ho, otherwise do not reject Ho-
O C. If the calculated test statistic F>
reject Ho, otherwise do not reject Ho.
O D. If the calculated test statistic F<
reject Ho, otherwise do not reject Ho.
b. Test the hypothesis and indicate whether the null hypothesis should be rejected.
Determine the test statistic.
F= (Round to two decimal places as needed.)
Chapter 12 Solutions
STATISTICAL TECH IN BUSN LLW/CONNECT
Ch. 12 - Steele Electric Products Inc. assembles cell...Ch. 12 - What is the critical F value when the sample size...Ch. 12 - Prob. 2ECh. 12 - Prob. 3ECh. 12 - Prob. 4ECh. 12 - Prob. 5ECh. 12 - Prob. 6ECh. 12 - Prob. 2SRCh. 12 - Prob. 7ECh. 12 - Prob. 8E
Ch. 12 - Prob. 9ECh. 12 - Prob. 10ECh. 12 - Prob. 3SRCh. 12 - Prob. 11ECh. 12 - The following are six observations collected from...Ch. 12 - Prob. 13ECh. 12 - Prob. 14ECh. 12 - Prob. 4SRCh. 12 - Prob. 15ECh. 12 - For exercises 15 and 16, conduct a test of...Ch. 12 - Prob. 17ECh. 12 - Prob. 18ECh. 12 - Prob. 5SRCh. 12 - Prob. 19ECh. 12 - Prob. 20ECh. 12 - Prob. 21ECh. 12 - Prob. 22ECh. 12 - Prob. 23CECh. 12 - Prob. 24CECh. 12 - Prob. 25CECh. 12 - Prob. 26CECh. 12 - In an ANOVA table, the MSE is equal to 10. Random...Ch. 12 - Prob. 28CECh. 12 - Prob. 29CECh. 12 - Prob. 30CECh. 12 - Prob. 31CECh. 12 - Prob. 32CECh. 12 - Prob. 33CECh. 12 - Prob. 34CECh. 12 - Prob. 35CECh. 12 - Prob. 36CECh. 12 - Prob. 37CECh. 12 - Prob. 38CECh. 12 - Prob. 39CECh. 12 - Prob. 40CECh. 12 - Prob. 41CECh. 12 - Prob. 42CECh. 12 - Prob. 43CECh. 12 - Prob. 44CECh. 12 - Prob. 45CECh. 12 - Prob. 46CECh. 12 - Prob. 47CECh. 12 - Prob. 48CECh. 12 - Prob. 50DACh. 12 - Prob. 51DACh. 12 - Prob. 1PCh. 12 - Prob. 2PCh. 12 - Prob. 3PCh. 12 - Prob. 4PCh. 12 - Prob. 5PCh. 12 - Prob. 6PCh. 12 - Prob. 7PCh. 12 - Prob. 1CCh. 12 - Prob. 2CCh. 12 - Prob. 1.1PTCh. 12 - The likelihood of rejecting a true null hypothesis...Ch. 12 - Prob. 1.3PTCh. 12 - Prob. 1.4PTCh. 12 - Prob. 1.5PTCh. 12 - Prob. 1.6PTCh. 12 - In a two-tailed test, the rejection region is...Ch. 12 - Prob. 1.8PTCh. 12 - Prob. 1.9PTCh. 12 - Prob. 1.10PTCh. 12 - Prob. 2.1PTCh. 12 - Prob. 2.2PTCh. 12 - Prob. 2.3PT
Knowledge Booster


Learn more about
Need a deep-dive on the concept behind this application? Look no further. Learn more about this topic, statistics and related others by exploring similar questions and additional content below.Similar questions
- What is meant by the sample space of an experiment?arrow_forwardWhat is an experiment?arrow_forwardThe accompanying table lists body temperatures (in °F) obtained from randomly selected subjects. Using a 0.05 significance level, test for an interaction between gender and smoking, test for an effect from gender, and test for an effect from smoking. What do you conclude? Click the icon to view the body temperature data. First test for an interaction between the two factors. Determine the null and alternative hypotheses. Choose the correct answer below. A. Ho: Body temperatures are not affected by gender. H₁: Body temperatures are affected by gender. B. Ho: Body temperatures are not affected by an interaction between gender and smoking. H₁: Body temperatures are affected by an interaction between gender and smoking. C. Ho: Body temperatures are affected by an interaction between gender and smoking. H₁: Body temperatures are not affected by an interaction between gender and smoking. D. Ho: Body temperatures are not affected by smoking. H₁: Body temperatures are affected by smoking.…arrow_forward
- Test the claim that the proportion of people who own cats is significantly different than 50% at the 0.01 significance level.The null and alternative hypothesis would be: H0:p=0.5H0:p=0.5H1:p≠0.5H1:p≠0.5 H0:μ=0.5H0:μ=0.5H1:μ≠0.5H1:μ≠0.5 H0:p≤0.5H0:p≤0.5H1:p>0.5H1:p>0.5 H0:μ≥0.5H0:μ≥0.5H1:μ<0.5H1:μ<0.5 H0:p≥0.5H0:p≥0.5H1:p<0.5H1:p<0.5 H0:μ≤0.5H0:μ≤0.5H1:μ>0.5H1:μ>0.5 The test is: left-tailed two-tailed right-tailed Based on a sample of 700 people, 43% owned catsThe p-value is: (to 2 decimals)Based on this we: Reject the null hypothesis Fail to reject the null hypothesisarrow_forwardTourism is extremely important to the economy of Florida. Hotel occupancy is an often-reported measure of visitor volume and visitor activity (Orlando Sentinel, May 19, 2018). Hotel occupancy data for February in two consecutive years are as follows. Current Year 1,476 1,800 Occupied Rooms Total Rooms 1,422 1,800 a. Formulate the hypothesis test that can be used to determine whether there has been an increase in the proportion of rooms occupied over the one-year period. Let P₁= population proportion of rooms occupied for current year P2 population proportion of rooms occupied for previous year - P2 less than or equal to 0 greater than 0 Ho P1 Ha P1 P2 b. What is the estimated proportion of hotel rooms occupied each year (to 2 decimals)? Current year .80 X Previous Year .77 c. Conduct a hypothesis test. What is the p-value (to 4 decimals)? Use Table 1 from Appendix B. Previous Year p-value = 0.0166 Using a 0.05 level of significance, what is your conclusion? We can conclude that there…arrow_forwardChantix (varenicline) is a drug used as an aid for those who want to stop smoking. The adverse reaction of nausea has been studied in clinical trials, and the table below summarizes results. Use a 0.01 significance level to test the claim that nausea is independent of whether the subject took a placebo or Chantix. Placebo Chantix Nausea 10 30 No Nausea 795 791 1.What is the conclusion of this study? 2.What is the decision rule of this study? 3. What is the computed Chi-square value?arrow_forward
- Test the claim that the proportion of men who own cats is significantly different than 20% at the 0.02 significance level. The null and alternative hypothesis would be: Ho:µ = 0.2 Ho:H = 0.2 Ho:p= 0.2 Ho:µ = 0.2 Ho:p= 0.2 Ho:p= 0.2 H1: µ > 0.2 H1:470.2 H1:p7 0.2 H1:µ 0.2 The test is: left-tailed right-tailed two-tailed Based on a sample of 4 people, 25% owned cats The test statistic is: (to 2 decimals) The positive critical value is: (to 2 decimals) Based on this we: O Reject the null hypothesis O Fail to reject the null hypothesis Check Answerarrow_forwardTest the claim that the proportion of people who own cats is significantly different than 25% at the 0.02 significance level.The null and alternative hypothesis would be: H0:μ=0.25H0:μ=0.25Ha:μ≠0.25Ha:μ≠0.25 H0:p=0.25H0:p=0.25Ha:p<0.25Ha:p<0.25 H0:μ=0.25H0:μ=0.25Ha:μ<0.25Ha:μ<0.25 H0:p=0.25H0:p=0.25Ha:p≠0.25Ha:p≠0.25 H0:μ=0.25H0:μ=0.25Ha:μ>0.25Ha:μ>0.25 H0:p=0.25H0:p=0.25Ha:p>0.25Ha:p>0.25 The test is: left-tailed two-tailed right-tailed Based on a sample of 400 people, 80 owned cats What is p̂ (to 2 decimal places)? The test statistic is: (to 2 decimals)The p-value is: (to 4 decimals, if your p-value is less than 0.0001, you may enter 0))Based on this we: Fail to reject the null hypothesis Reject the null hypothesisarrow_forwardTest the claim that the proportion of people who own cats is significantly different than 80% at the 0.1 significance level.The null and alternative hypothesis would be: H0:μ=0.8H0:μ=0.8H1:μ≠0.8H1:μ≠0.8 H0:p=0.8H0:p=0.8H1:p≠0.8H1:p≠0.8 H0:p≤0.8H0:p≤0.8H1:p>0.8H1:p>0.8 H0:p≥0.8H0:p≥0.8H1:p<0.8H1:p<0.8 H0:μ≤0.8H0:μ≤0.8H1:μ>0.8H1:μ>0.8 H0:μ≥0.8H0:μ≥0.8H1:μ<0.8H1:μ<0.8 The test is: right-tailed left-tailed two-tailed Based on a sample of 200 people, 87% owned catsThe p-value is: (to 2 decimals)Based on this we: Reject the null hypothesis Fail to reject the null hypothesisarrow_forward
- Test the claim that the proportion of people who own cats is smaller than 90% at the 0.025 significance level.The null and alternative hypothesis would be: A. H0:μ=0.9 Ha:μ<0.9 B. H0:p=0.9 Ha:p>0.9 C. H0:μ=0.9 Ha:μ≠0.9 D. H0:p=0.9 Ha:p≠0.9 E. H0:μ=0.9 Ha:μ>0.9 F. H0:p=0.9 Ha:p<0.9 The standardized test is: two-tailed left-tailed right-tailed Based on a sample of 122 people, 81% owned catsThe test statistic is: (to 2 decimals)The P-value is: (to 4 decimals)Based on this we: Fail to reject the null hypothesis Reject the null hypothesisarrow_forward2. (Table: TV and Aggressiveness) In a fictional study, a pretest-posttest design was used to examine the influence of a television program on children's aggressiveness. The number of aggressive responses was measured during an observation period both before and after the television program. Calculate the appropriate test statistic to hypothesis test whether or not there is a difference in the number of aggressive behaviors in children after having viewed the television program. Use a = .05 and calculate the test statistic as a two tailed test. Table: TV and Aggressiveness Participant 1 2 3 4 5 6 7 Before 6 4 12 9 10 2 14 After 9 3 11 12 14 6 12arrow_forwardTest the claim that the proportion of men who own cats is significantly different than 30% at the 0.01 significance level. The null and alternative hypothesis would be: Ho:p = 0.3 Ho:p = 0.3 Ho:u = 0.3 Ho:µ = 0.3 Ho:p = 0.3 Ho:u = 0.3 H1:p # 0.3 H1:p > 0.3 H1:4 > 0.3 H1:µ < 0.3 H1:p < 0.3 H1:u + 0.3 The test is: left-tailed two-tailed right-tailed Based on a sample of 50 people, 22% owned cats The test statistic is: (to 2 decimals) The positive critical value is: (to 2 decimals) Based on this we: O Fail to reject the null hypothesis Reject the null hypothesisarrow_forward
arrow_back_ios
SEE MORE QUESTIONS
arrow_forward_ios
Recommended textbooks for you
 College Algebra (MindTap Course List)AlgebraISBN:9781305652231Author:R. David Gustafson, Jeff HughesPublisher:Cengage Learning
 Glencoe Algebra 1, Student Edition, 9780079039897...AlgebraISBN:9780079039897Author:CarterPublisher:McGraw Hill
College Algebra (MindTap Course List)
Algebra
ISBN:9781305652231
Author:R. David Gustafson, Jeff Hughes
Publisher:Cengage Learning
Glencoe Algebra 1, Student Edition, 9780079039897...
Algebra
ISBN:9780079039897
Author:Carter
Publisher:McGraw Hill
Hypothesis Testing using Confidence Interval Approach; Author: BUM2413 Applied Statistics UMP;https://www.youtube.com/watch?v=Hq1l3e9pLyY;License: Standard YouTube License, CC-BY
Hypothesis Testing - Difference of Two Means - Student's -Distribution & Normal Distribution; Author: The Organic Chemistry Tutor;https://www.youtube.com/watch?v=UcZwyzwWU7o;License: Standard Youtube License