
EBK STATISTICAL TECHNIQUES IN BUSINESS
17th Edition
ISBN: 9781259924163
Author: Lind
Publisher: MCGRAW HILL BOOK COMPANY
expand_more
expand_more
format_list_bulleted
Concept explainers
Videos
Textbook Question
Chapter 12, Problem 16E
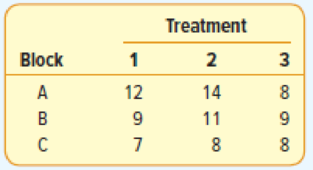
For exercises 15 and 16, conduct a test of hypothesis to determine whether the block or the treatment means differ. Using the .05 significance level: (a) state the null and alternate hypotheses for treatments; (b) state the decision rule for treatments; and (c) state the null and alternate hypotheses for blocks. Also, state the decision rule for blocks, then: (d) compute SST, SSB, SS total, and SSE; (e) complete an ANOVA table; and (f) give your decision regarding the two sets of hypotheses and interpret the results.
The following data was collected for a two-factor ANOVA with three treatments and three blocks.
Expert Solution & Answer
Want to see the full answer?
Check out a sample textbook solution
Students have asked these similar questions
Given the situation below, create a problem and determine (a) the null and alternative hypotheses, (b) test statistic, (c) rejection region, and (d) applicability of the CLT.
The proportion of mango trees on an island that produce only dwarf fruit is p1. The proportion of mango trees on a different island that produce only dwarf fruit is p2. What is the null hypothesis for a test to determine if the proportions are different between the two islands?
Select the correct answer below:
H0: p1−p2≠0
H0: p1−p2=0
H0: p1−p2>0
H0: p1−p2<0
Back in April and May of 1985, the Gallup organization conducted a poll to estimate the percentage of Americans who approved of how President Reagan was handling his job. At the 5% significance level, do the data suggest that the percentage of those who approved of Reagan increased from April to May in 1985? Population 1: April p = 795/1528 = 0.5203 Population 2: May p = 840/1528 = 0.5497
Show all your steps, setting up your null and alternative hypothesis.
Chapter 12 Solutions
EBK STATISTICAL TECHNIQUES IN BUSINESS
Ch. 12 - Steele Electric Products Inc. assembles cell...Ch. 12 - What is the critical F value when the sample size...Ch. 12 - Prob. 2ECh. 12 - Prob. 3ECh. 12 - Prob. 4ECh. 12 - Prob. 5ECh. 12 - Prob. 6ECh. 12 - Prob. 2SRCh. 12 - Prob. 7ECh. 12 - Prob. 8E
Ch. 12 - Prob. 9ECh. 12 - Prob. 10ECh. 12 - Prob. 3SRCh. 12 - Prob. 11ECh. 12 - The following are six observations collected from...Ch. 12 - Prob. 13ECh. 12 - Prob. 14ECh. 12 - Prob. 4SRCh. 12 - Prob. 15ECh. 12 - For exercises 15 and 16, conduct a test of...Ch. 12 - Prob. 17ECh. 12 - Prob. 18ECh. 12 - Prob. 5SRCh. 12 - Prob. 19ECh. 12 - Prob. 20ECh. 12 - Prob. 21ECh. 12 - Prob. 22ECh. 12 - Prob. 23CECh. 12 - Prob. 24CECh. 12 - Prob. 25CECh. 12 - Prob. 26CECh. 12 - In an ANOVA table, the MSE is equal to 10. Random...Ch. 12 - Prob. 28CECh. 12 - Prob. 29CECh. 12 - Prob. 30CECh. 12 - Prob. 31CECh. 12 - Prob. 32CECh. 12 - Prob. 33CECh. 12 - Prob. 34CECh. 12 - Prob. 35CECh. 12 - Prob. 36CECh. 12 - Prob. 37CECh. 12 - Prob. 38CECh. 12 - Shanks Inc., a nationwide advertising firm, wants...Ch. 12 - Prob. 40CECh. 12 - Prob. 41CECh. 12 - Prob. 42CECh. 12 - Prob. 43CECh. 12 - Prob. 44CECh. 12 - Prob. 45CECh. 12 - Prob. 46CECh. 12 - Prob. 47CECh. 12 - Prob. 48CECh. 12 - Prob. 50DACh. 12 - Prob. 51DACh. 12 - Prob. 1PCh. 12 - Prob. 2PCh. 12 - Prob. 3PCh. 12 - Prob. 4PCh. 12 - Prob. 5PCh. 12 - Prob. 6PCh. 12 - Prob. 7PCh. 12 - Prob. 1CCh. 12 - Prob. 2CCh. 12 - Prob. 1.1PTCh. 12 - The likelihood of rejecting a true null hypothesis...Ch. 12 - Prob. 1.3PTCh. 12 - Prob. 1.4PTCh. 12 - Prob. 1.5PTCh. 12 - Prob. 1.6PTCh. 12 - In a two-tailed test, the rejection region is...Ch. 12 - Prob. 1.8PTCh. 12 - Prob. 1.9PTCh. 12 - Prob. 1.10PTCh. 12 - Prob. 2.1PTCh. 12 - Prob. 2.2PTCh. 12 - Prob. 2.3PT
Knowledge Booster


Learn more about
Need a deep-dive on the concept behind this application? Look no further. Learn more about this topic, statistics and related others by exploring similar questions and additional content below.Similar questions
- If the proportion of the population in City A that is over 65 years old is p1 and the proportion of the population in City B that is over 65 years old is p2, what is the null hypothesis for a test to determine if the proportion of the population that is over 65 years old is greater in City A? Select the correct answer below: H0: p1−p2=0 H0: p1−p2>0 H0: p1−p2<0 H0: p1−p2≠0arrow_forwardTest the null hypothesis H0 : β1 = β2 against the alternative H1 : β1 < β2 at 1% significance level.arrow_forwardA fast-food restaurant claims that a small order of french fries contains 120 calories. A nutritionist is concerned that the true average calorie count is higher than that. The nutritionist randomly selects 35 small orders of french fries and determines their calories. The resulting sample mean is 155.6 calories, and the pp-value for the hypothesis test is 0.00093. Which of the following is a correct interpretation of the p-value? A)If the population mean is 120 calories, the p -value of 0.00093 is the probability of observing a sample mean of 155.6 calories or more. B) If the population mean is 120 calories, the p -value of 0.00093 is the probability of observing a sample mean of 155.6 calories or less. C)If the population mean is 120 calories, the p -value of 0.00093 is the probability of observing a sample mean of 155.6 calories or more, or a sample mean of 84.4 calories or less. .D)If the population mean is 155.6 calories, the p -value of 0.00093…arrow_forward
- At many college bookstores, students can decide whether to purchase or to rent a textbook for a class. A study was conducted to investigate whether the percent of rented textbooks for all science classes in the state was greater than the percent of rented textbooks for all literature classes in the state. The following hypothesis test was done at the significance level of α=0.05α=0.05. H0:pS=pLHa:pS>pLH0:pS=pLHa:pS>pL In the hypotheses, pSpS represents the proportion of all science textbooks that are rented, and pLpL represents the proportion of all literature textbooks that are rented. All conditions for inference were met, and the resulting pp-value was 0.035. Which of the following is the correct decision for the test? The pp-value is less than αα. Since 0.035<0.050.035<0.05, the null hypothesis is rejected, and the claim is supported. There is convincing statistical evidence that the proportion of all science textbooks that are rented is greater…arrow_forwardIn each of Exercises, we have provided a null hypothesis and alternative hypothesis and a sample from the population under consideration. In each case, use theWilcoxon signed-rank test to perform the required hypothesis test at the 10% significance level. H0: µ = 5, Ha: µ > 5 12 7 11 9 3 2 8 6arrow_forwardIn performing a hypothesis T-test, the p-value was 0.00046 and the significance level was 5%. What is the conclusion? Is it a,b,or c? a. Reject the null hypothesis and accept the alternate hypothesis b. Accept both the null hypothesis and alternate hypothesis c. Fail to reject the null hypothesisarrow_forward
- In each of Exercises, we have provided a null hypothesis and alternative hypothesis and a sample from the population under consideration. In each case, use theWilcoxon signed-rank test to perform the required hypothesis test at the 10% significance level. H0: µ = 10, Ha: µ<10 7 6 5 12 15 14 13 4arrow_forwardBack in April and May of 1985, the Gallup organization conducted a poll to estimate the percentage of Americans who approved of how President Reagan was handling his job. At the 5% significance level, do the data suggest that the percentage of those who approved of Reagan increased from April to May in 1985? Population 1: April p = 795/1528 = 0.5203Population 2: May p = 840/1528 = 0.5497Show all your steps, setting up your null and alternative hypothesis.arrow_forwardTest the claim that the proportion of people who own cats is smaller than 20% at the 0.005 significance level.The null and alternative hypothesis would be: Select One ______ H0:p≤0.2H0:p≤0.2Ha:p>0.2Ha:p>0.2 _______H0:μ≥0.2H0:μ≥0.2Ha:μ<0.2Ha:μ<0.2 _____H0:μ=0.2H0:μ=0.2Ha:μ≠0.2Ha:μ≠0.2 ______H0:p=0.2H0:p=0.2Ha:p≠0.2Ha:p≠0.2 _______H0:p≥0.2H0:p≥0.2Ha:p<0.2Ha:p<0.2 ______H0:μ≤0.2H0:μ≤0.2Ha:μ>0.2Ha:μ>0.2 The test is: Select One ___two-tailed ___left-tailed ___right-tailed Based on a sample of 600 people, 19% owned catsThe test statistic is: __?__ (Round to 2 decimals)The p-value is: __?__ (Round to 2 decimals)arrow_forward
- A small diner gets eggs from 2 suppliers. a sample of 50 eggs from supplier A had a STDEV of 1.1 grams. a sample from supplier B of 40 eggs had a STDEV of .75 grams.a) Construct a 99% confidence for STDEV of supplier BB) at a 4% confidence, conduct a hypothesis test to determine if theres any difference in STDEV between supplier a and barrow_forwardFor the following cases, you may use either the P-value approach or the rejection region approach to present a full hypothesis test, including: Identifying the claim and H0 and Ha, Finding the appropriate standardized test statistic, Finding the P-value or the rejection region, Deciding whether to reject or fail to reject the null hypothesis, and Interpreting the decision in the context of the original claim. A scientist claims that pneumonia causes weight loss in mice. The table below shows weight, in grams, of six mice before infection with pneumonia and two days after infection. At α = 0.01, evaluate the scientist’s claim. Before After Mouse 1 19.8 18.4 Mouse 2 20.2 19.6 Mouse 3 19.9 19.1 Mouse 4 22.1 20.7 Mouse 5 23.4 22.2 Mouse 6 23.6 23.0arrow_forwardThe critical boundaries for a hypothesis test are z = +1.96 and -1.96. If the z-score for the sample mean is zM = +2.20, what is the correct statistical decision?arrow_forward
arrow_back_ios
SEE MORE QUESTIONS
arrow_forward_ios
Recommended textbooks for you
 MATLAB: An Introduction with ApplicationsStatisticsISBN:9781119256830Author:Amos GilatPublisher:John Wiley & Sons Inc
 Probability and Statistics for Engineering and th...StatisticsISBN:9781305251809Author:Jay L. DevorePublisher:Cengage Learning
 Statistics for The Behavioral Sciences (MindTap C...StatisticsISBN:9781305504912Author:Frederick J Gravetter, Larry B. WallnauPublisher:Cengage Learning
 Elementary Statistics: Picturing the World (7th E...StatisticsISBN:9780134683416Author:Ron Larson, Betsy FarberPublisher:PEARSON
 The Basic Practice of StatisticsStatisticsISBN:9781319042578Author:David S. Moore, William I. Notz, Michael A. FlignerPublisher:W. H. Freeman
 Introduction to the Practice of StatisticsStatisticsISBN:9781319013387Author:David S. Moore, George P. McCabe, Bruce A. CraigPublisher:W. H. Freeman
MATLAB: An Introduction with Applications
Statistics
ISBN:9781119256830
Author:Amos Gilat
Publisher:John Wiley & Sons Inc
Probability and Statistics for Engineering and th...
Statistics
ISBN:9781305251809
Author:Jay L. Devore
Publisher:Cengage Learning
Statistics for The Behavioral Sciences (MindTap C...
Statistics
ISBN:9781305504912
Author:Frederick J Gravetter, Larry B. Wallnau
Publisher:Cengage Learning
Elementary Statistics: Picturing the World (7th E...
Statistics
ISBN:9780134683416
Author:Ron Larson, Betsy Farber
Publisher:PEARSON
The Basic Practice of Statistics
Statistics
ISBN:9781319042578
Author:David S. Moore, William I. Notz, Michael A. Fligner
Publisher:W. H. Freeman
Introduction to the Practice of Statistics
Statistics
ISBN:9781319013387
Author:David S. Moore, George P. McCabe, Bruce A. Craig
Publisher:W. H. Freeman
Hypothesis Testing - Solving Problems With Proportions; Author: The Organic Chemistry Tutor;https://www.youtube.com/watch?v=76VruarGn2Q;License: Standard YouTube License, CC-BY
Hypothesis Testing and Confidence Intervals (FRM Part 1 – Book 2 – Chapter 5); Author: Analystprep;https://www.youtube.com/watch?v=vth3yZIUlGQ;License: Standard YouTube License, CC-BY