
STATISTICAL TECHNIQUES IN BUSINESS AND E
18th Edition
ISBN: 9781260570489
Author: Lind
Publisher: MCG
expand_more
expand_more
format_list_bulleted
Concept explainers
Videos
Textbook Question
Chapter 12, Problem 16E
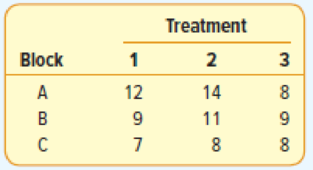
For exercises 15 and 16, conduct a test of hypothesis to determine whether the block or the treatment means differ. Using the .05 significance level: (a) state the null and alternate hypotheses for treatments; (b) state the decision rule for treatments; and (c) state the null and alternate hypotheses for blocks. Also, state the decision rule for blocks, then: (d) compute SST, SSB, SS total, and SSE; (e) complete an ANOVA table; and (f) give your decision regarding the two sets of hypotheses and interpret the results.
The following data was collected for a two-factor ANOVA with three treatments and three blocks.
Expert Solution & Answer
Want to see the full answer?
Check out a sample textbook solution
Students have asked these similar questions
None
A researcher selects a sample and administers a treatment for anxiety to the individuals in the sample. If the sample is used
for a hypothesis test, what does the null hypothesis (Ho) put forth about the treatment?
O The treatment has an effect on anxiety.
O The treatment divides each anxiety score by a constant.
O The treatment multiplies each anxiety score by a constant.
The treatment has no effect on anxiety.
Let p1 be the proportion of residents in Country A coping with depression, and let p2 be the proportion of residents in Country B coping with depression. What is the null hypothesis for a test to determine whether Country A has a greater proportion of residents coping with depression than Country B?
Select the correct answer below:
H0: p1−p2>0
H0: p1−p2<0
H0: p1−p2=0
H0: p1−p2≠0
Chapter 12 Solutions
STATISTICAL TECHNIQUES IN BUSINESS AND E
Ch. 12 - Steele Electric Products Inc. assembles cell...Ch. 12 - What is the critical F value when the sample size...Ch. 12 - Prob. 2ECh. 12 - Prob. 3ECh. 12 - Prob. 4ECh. 12 - Prob. 5ECh. 12 - Prob. 6ECh. 12 - Prob. 2SRCh. 12 - Prob. 7ECh. 12 - Prob. 8E
Ch. 12 - Prob. 9ECh. 12 - Prob. 10ECh. 12 - Prob. 3SRCh. 12 - Prob. 11ECh. 12 - The following are six observations collected from...Ch. 12 - Prob. 13ECh. 12 - Prob. 14ECh. 12 - Prob. 4SRCh. 12 - Prob. 15ECh. 12 - For exercises 15 and 16, conduct a test of...Ch. 12 - Prob. 17ECh. 12 - Prob. 18ECh. 12 - Prob. 5SRCh. 12 - Prob. 19ECh. 12 - Prob. 20ECh. 12 - Prob. 21ECh. 12 - Prob. 22ECh. 12 - Prob. 23CECh. 12 - Prob. 24CECh. 12 - Prob. 25CECh. 12 - Prob. 26CECh. 12 - In an ANOVA table, the MSE is equal to 10. Random...Ch. 12 - Prob. 28CECh. 12 - Prob. 29CECh. 12 - Prob. 30CECh. 12 - Prob. 31CECh. 12 - Prob. 32CECh. 12 - Prob. 33CECh. 12 - Prob. 34CECh. 12 - Prob. 35CECh. 12 - Prob. 36CECh. 12 - Prob. 37CECh. 12 - Prob. 38CECh. 12 - Prob. 39CECh. 12 - Prob. 40CECh. 12 - Prob. 41CECh. 12 - Prob. 42CECh. 12 - Prob. 43CECh. 12 - Prob. 44CECh. 12 - Prob. 45CECh. 12 - Prob. 46CECh. 12 - Prob. 47CECh. 12 - Prob. 48CECh. 12 - Prob. 50DACh. 12 - Prob. 51DACh. 12 - Prob. 1PCh. 12 - Prob. 2PCh. 12 - Prob. 3PCh. 12 - Prob. 4PCh. 12 - Prob. 5PCh. 12 - Prob. 6PCh. 12 - Prob. 7PCh. 12 - Prob. 1CCh. 12 - Prob. 2CCh. 12 - Prob. 1.1PTCh. 12 - The likelihood of rejecting a true null hypothesis...Ch. 12 - Prob. 1.3PTCh. 12 - Prob. 1.4PTCh. 12 - Prob. 1.5PTCh. 12 - Prob. 1.6PTCh. 12 - In a two-tailed test, the rejection region is...Ch. 12 - Prob. 1.8PTCh. 12 - Prob. 1.9PTCh. 12 - Prob. 1.10PTCh. 12 - Prob. 2.1PTCh. 12 - Prob. 2.2PTCh. 12 - Prob. 2.3PT
Knowledge Booster


Learn more about
Need a deep-dive on the concept behind this application? Look no further. Learn more about this topic, statistics and related others by exploring similar questions and additional content below.Similar questions
- The following table contains the number of successes and failures for three categories of a variable. Test whether the proportions are equal for each category at the α=0.1 level of significance. Category 1 Category 2 Category 3 Failures 32 51 57 Successes 39 54 73 State the hypotheses. Choose the correct answer below. A. H0: The categories of the variable and success and failure are independent. H1: The categories of the variable and success and failure are dependent. B. H0: The categories of the variable and success and failure are dependent. H1: The categories of the variable and success and failure are independent. C. H0: p1=p2=p3 H1: At least one of the proportions is different from the others. D. H0: μ1=E1 and μ2=E2 and μ3=E3 H1: At least one mean is different from what is expected. What is the P-value? nothing (Round to three decimal places as needed.) What conclusion can be…arrow_forwardA researcher selects a sample and administers treatment for anxiety to the individuals in the sample. If the sample is used for a hypothesis test, what does the null hypothesis (H0) put forth about the treatment? Group of answer choices The treatment has an effect on anxiety. The treatment divides each anxiety score by a constant. The treatment multiplies each anxiety score by a constant. The treatment has no effect on anxiety.arrow_forwardWith the information shown, Please do step 3 & 4 of the hypothesis testing 1.The number of people who survived the Titanic based on class and sex is collected is collected in the table. Is there enough evidence to show that the class and the sex of a person who survived the Titanic are independent? 0.05 significance level. Null Hypothesis: class and sex of a person who survived the titanic are independent. Alternative Hypothesis: class and sex of a person who survived the titanic are dependent. The contingency table is: Class Male Female Total 1st 134 59 193 2nd 94 25 119 3rd 80 58 138 Total 308 142 450 Expected frequencies table is: Class Male Female Total 1st 193×308450=132.09 193×142450=60.90 193 2nd 119×308450=81.45…arrow_forward
- The following table contains the number of successes and failures for three categories of a variable. Test whether the proportions are equal for each category at the a = 0.1 level of significance. Category Category 2 Category Failures 34 78 44 Successes 24 50 88 EClick the icon to view the Chi-Square table of critical values. State the hypotheses. Choose the correct answer below A. H:The categories of the variable and success and failure are independent. H: The categories of the variable and success and failure are dependent. B. Ho H1 E and u2 E2 and H,: At least one mean is different from what is expected. H3 E3 C. H: The categories of the variable and success and failure are dependent H: The categories of the variable and success and failure are independent. OD. H: p. pp Click to select your answer(s).arrow_forwardThe following table contains the number of successes and failures for three categories of a variable. Test whether the proportions are equal for each category at the x = 0.01 level of significance. Category 1 Category 2 Category 3 Failures 39 83 47 Successes 30 65 38 Click the icon to view the Chi-Square table of critical values. State the hypotheses. Choose the correct answer below. OA. Ho: The categories of the variable and success and failure are independent. H₁: The categories of the variable and success and failure are dependent. OB. Ho: The categories of the variable and success and failure are dependent. H₁: The categories of the variable and success and failure are independent. C. Ho: P1 P2 P3 H₁: At least one of the proportions is different from the others. OD. Ho: H₁=E₁ and μ₂ = E₂ and μ3 = E3 H₁: At least one mean is different from what is expected. Compute the value of the chi-square test statistic. xo (Round to three decimal places as needed.)arrow_forwardMolly works for a meat producer, and she needs to determine whether containers of ground beef have the correct fat content. She obtains a random sample of 120 containers of ground beef and finds that 84 percent have the correct fat content. Molly then conducts a hypothesis test of H0:p=0.80H0:p=0.80 versus Ha:p≠0.80Ha:p≠0.80 and calculates a test statistic of 1.10 with a pp-value of 0.273. Which of the following best represents the meaning of the pp-value? If the population proportion is 0.84, the probability of observing a sample proportion of 0.80 is 0.273. A If the population proportion is 0.84, the probability of observing a sample proportion of at least 0.04 less than 0.84 is 0.273. B If the population proportion is 0.80, the probability of observing a sample proportion within 0.04 of 0.80 is 0.273. C If the population proportion is 0.80, the probability of observing a sample proportion at least 0.04 greater than 0.80 is 0.273. D If the…arrow_forward
- From the table on the image: Construct an appropriate hypothesis test to determine whether or not there is an association between experiencing phenomena such as seeing a ghost and the age group you are in. Write the appropriate null/alternative hypothesis and carry out the test. Use a significance level of α = 0.01.arrow_forwardThe city council is considering a law that would ban smoking in all public facilities. A sample has been selected from the community and tested for support of the ordinance. Is there a statistically significant relationship between age and support for the anti-smoking law? Use the five-step model in making the hypothesis test and write a sentence or two interpreting your results. Use α = .05. Support For Against Total Less than 40 145 103 248 More than 40 Total Age 78 223 169 272 247 495arrow_forwardThe proportion of mango trees on an island that produce only dwarf fruit is p1. The proportion of mango trees on a different island that produce only dwarf fruit is p2. What is the null hypothesis for a test to determine if the proportions are different between the two islands? Select the correct answer below: H0: p1−p2≠0 H0: p1−p2=0 H0: p1−p2>0 H0: p1−p2<0arrow_forward
- Test the claim that the proportion of people who own cats is significantly different than 80% at the 0.05 significance level.The null and alternative hypothesis would be:arrow_forwardDecide whether to reject or fail to reject the null hypothesis. Choose the correct answer below.arrow_forwardA researcher was interested in the relationship between eye color and hair color in a population of high school students. The data collected is shown below. The researcher plans on performing a test of independence on the variables using a 5% level of significance. Blue eyes Brown eyes Green eyes Other Black hair 6 1 10 9 Blonde hair 10 9 Tools Table 1 Brown hair 1 10 1 10 Red hair 7 0 1 8 Summarize the results of this hypothesis test. Your answer should be in the form of a complete sentence and use appropriate vocabulary. Edit View Insert Format Other 11 5 9 6arrow_forward
arrow_back_ios
SEE MORE QUESTIONS
arrow_forward_ios
Recommended textbooks for you
 Glencoe Algebra 1, Student Edition, 9780079039897...AlgebraISBN:9780079039897Author:CarterPublisher:McGraw Hill
 Holt Mcdougal Larson Pre-algebra: Student Edition...AlgebraISBN:9780547587776Author:HOLT MCDOUGALPublisher:HOLT MCDOUGAL
Glencoe Algebra 1, Student Edition, 9780079039897...
Algebra
ISBN:9780079039897
Author:Carter
Publisher:McGraw Hill
Holt Mcdougal Larson Pre-algebra: Student Edition...
Algebra
ISBN:9780547587776
Author:HOLT MCDOUGAL
Publisher:HOLT MCDOUGAL
Hypothesis Testing - Solving Problems With Proportions; Author: The Organic Chemistry Tutor;https://www.youtube.com/watch?v=76VruarGn2Q;License: Standard YouTube License, CC-BY
Hypothesis Testing and Confidence Intervals (FRM Part 1 – Book 2 – Chapter 5); Author: Analystprep;https://www.youtube.com/watch?v=vth3yZIUlGQ;License: Standard YouTube License, CC-BY