
CONNECT F/OPERATIONS MGMT
14th Edition
ISBN: 9781264344963
Author: Stevenson
Publisher: INTER MCG
expand_more
expand_more
format_list_bulleted
Concept explainers
Videos
Textbook Question
Chapter 12, Problem 41P
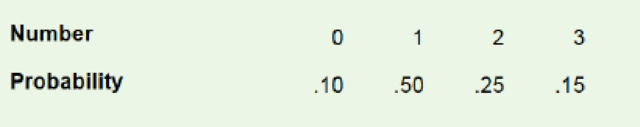
A manager is going to purchase new processing equipment and must decide on the number of spare parts to order with the new equipment. The spares cost $200 each, and any unused spares will have an expected salvage value of $50 each. The probability of usage can be described by this distribution:
If a part fails and a spare is not available, two days will be needed to obtain a replacement and install it. The cost for idle equipment is $500 per day. What quantity of spares should be ordered?
a. Use the ratio method.
b. Use the tabular method (see Table 13.3).
Expert Solution & Answer
Want to see the full answer?
Check out a sample textbook solution
Chapter 12 Solutions
CONNECT F/OPERATIONS MGMT
Ch. 12.3 - Prob. 1RQCh. 12 - What are the primary reasons for holding...Ch. 12 - What are the requirements for effective inventory...Ch. 12 - Briefly describe each of the costs associated with...Ch. 12 - What potential benefits and risks do RFID tags...Ch. 12 - Prob. 5DRQCh. 12 - Prob. 6DRQCh. 12 - a. List the major assumptions of the EOQ model. b....Ch. 12 - Explain briefly how a higher carrying cost can...Ch. 12 - What is safety stock, and what is its purpose?
Ch. 12 - Prob. 10DRQCh. 12 - What is meant by the term service level? Generally...Ch. 12 - Describe briefly the A-B-C approach to inventory...Ch. 12 - The purchasing agent for a company that assembles...Ch. 12 - Explain how a decrease in setup time can lead to a...Ch. 12 - What is the single-period model, and under what...Ch. 12 - Can the optimal stocking level in the...Ch. 12 - Prob. 17DRQCh. 12 - What trade-offs are involved in each of these...Ch. 12 - Who needs to be involved in inventory decisions...Ch. 12 - How has technology aided inventory management? How...Ch. 12 - To be competitive, many fast-food chains began to...Ch. 12 - As a supermarket manager, how would you go about...Ch. 12 - Sam is at the post office to mail a package. After...Ch. 12 - Give two examples of unethical conduct involving...Ch. 12 - Prob. 1PCh. 12 - a. The following table contains figures on the...Ch. 12 - A bakery buys flours in 25-pound bags. The bakery...Ch. 12 - A large law firm uses an average of 40 boxes of...Ch. 12 - Garden Variety Flower Shop uses 750 clay pots a...Ch. 12 - A produce distributor uses 800 packing crates a...Ch. 12 - A manager receives a forecast for next year....Ch. 12 - A food processor uses approximately 27,000 glass...Ch. 12 - The Friendly Sausage Factory (FSF) can produce hot...Ch. 12 - A chemical firm produces sodium bisulfate in...Ch. 12 - A company is about to begin production of a new...Ch. 12 - Prob. 12PCh. 12 - A mail-order house uses 18,000 boxes a year....Ch. 12 - A jewelry firm buys semiprecious stones to make...Ch. 12 - A manufacturer of exercise equipment purchases the...Ch. 12 - A company will begin stocking remote control...Ch. 12 - A manager just received a new price list from a...Ch. 12 - A newspaper publisher uses roughly 800 feet of...Ch. 12 - Given this information: Expected demand during...Ch. 12 - Given this information: Lead-time demand = 600...Ch. 12 - Demand for walnut fudge ice cream at the Sweet...Ch. 12 - The injection molding department of a company uses...Ch. 12 - A company uses 85 circuit boards a day in a...Ch. 12 - One item a computer store sells is supplied by a...Ch. 12 - The manager of a car wash received a revised price...Ch. 12 - A small copy center uses five 500-sheet boxes of...Ch. 12 - Ned's Natural Foods sells unshelled peanuts by the...Ch. 12 - Regional Supermarket is open 360 days per year....Ch. 12 - A service station uses 1,200 cases of oil a year....Ch. 12 - Caring Hospital's dispensary reorders doses of a...Ch. 12 - A drugstore uses fixed-order cycles for many of...Ch. 12 - Prob. 32PCh. 12 - Prob. 33PCh. 12 - Demand for jelly doughnuts on Saturdays at Don's...Ch. 12 - A public utility intends to buy a turbine as part...Ch. 12 - Skinner's Fish Market buys fresh Boston bluefish...Ch. 12 - A small grocery store sells fresh produce, which...Ch. 12 - Demand for devil's food whipped-cream layer cake...Ch. 12 - Prob. 39PCh. 12 - Demand for rug-cleaning machines at Clyde's...Ch. 12 - A manager is going to purchase new processing...Ch. 12 - A Las Vegas supermarket bakery must decide how...Ch. 12 - Offwego Airlines has a daily flight from Chicago...Ch. 12 - UPD Manufacturing produces a range of health care...Ch. 12 - Prob. 1.2CQCh. 12 - Prob. 2.1CQCh. 12 - SARAH LUBBERS AND CHRIS RUSCHE, GRAND VALLEY STATE...Ch. 12 - SARAH LUBBERS AND CHRIS RUSCHE, GRAND VALLEY STATE...Ch. 12 - Prob. 3.3CQCh. 12 - SARAH LUBBERS AND CHRIS RUSCHE, GRAND VALLEY STATE...Ch. 12 - Prob. 3.5CQCh. 12 - Prob. 1OTQCh. 12 - Prob. 2OTQCh. 12 - Prob. 3OTQCh. 12 - Prob. 4OTQ
Knowledge Booster


Learn more about
Need a deep-dive on the concept behind this application? Look no further. Learn more about this topic, operations-management and related others by exploring similar questions and additional content below.Similar questions
- You now have 10,000, all of which is invested in a sports team. Each year there is a 60% chance that the value of the team will increase by 60% and a 40% chance that the value of the team will decrease by 60%. Estimate the mean and median value of your investment after 50 years. Explain the large difference between the estimated mean and median.arrow_forwardW. L. Brown, a direct marketer of womens clothing, must determine how many telephone operators to schedule during each part of the day. W. L. Brown estimates that the number of phone calls received each hour of a typical eight-hour shift can be described by the probability distribution in the file P10_33.xlsx. Each operator can handle 15 calls per hour and costs the company 20 per hour. Each phone call that is not handled is assumed to cost the company 6 in lost profit. Considering the options of employing 6, 8, 10, 12, 14, or 16 operators, use simulation to determine the number of operators that minimizes the expected hourly cost (labor costs plus lost profits).arrow_forwardA common decision is whether a company should buy equipment and produce a product in house or outsource production to another company. If sales volume is high enough, then by producing in house, the savings on unit costs will cover the fixed cost of the equipment. Suppose a company must make such a decision for a four-year time horizon, given the following data. Use simulation to estimate the probability that producing in house is better than outsourcing. If the company outsources production, it will have to purchase the product from the manufacturer for 25 per unit. This unit cost will remain constant for the next four years. The company will sell the product for 42 per unit. This price will remain constant for the next four years. If the company produces the product in house, it must buy a 500,000 machine that is depreciated on a straight-line basis over four years, and its cost of production will be 9 per unit. This unit cost will remain constant for the next four years. The demand in year 1 has a worst case of 10,000 units, a most likely case of 14,000 units, and a best case of 16,000 units. The average annual growth in demand for years 2-4 has a worst case of 7%, a most likely case of 15%, and a best case of 20%. Whatever this annual growth is, it will be the same in each of the years. The tax rate is 35%. Cash flows are discounted at 8% per year.arrow_forward
- Six months before its annual convention, the American Medical Association must determine how many rooms to reserve. At this time, the AMA can reserve rooms at a cost of 150 per room. The AMA believes the number of doctors attending the convention will be normally distributed with a mean of 5000 and a standard deviation of 1000. If the number of people attending the convention exceeds the number of rooms reserved, extra rooms must be reserved at a cost of 250 per room. a. Use simulation with @RISK to determine the number of rooms that should be reserved to minimize the expected cost to the AMA. Try possible values from 4100 to 4900 in increments of 100. b. Redo part a for the case where the number attending has a triangular distribution with minimum value 2000, maximum value 7000, and most likely value 5000. Does this change the substantive results from part a?arrow_forwardAssume a very good NBA team has a 70% chance of winning in each game it plays. During an 82-game season what is the average length of the teams longest winning streak? What is the probability that the team has a winning streak of at least 16 games? Use simulation to answer these questions, where each iteration of the simulation generates the outcomes of all 82 games.arrow_forwardBased on Babich (1992). Suppose that each week each of 300 families buys a gallon of orange juice from company A, B, or C. Let pA denote the probability that a gallon produced by company A is of unsatisfactory quality, and define pB and pC similarly for companies B and C. If the last gallon of juice purchased by a family is satisfactory, the next week they will purchase a gallon of juice from the same company. If the last gallon of juice purchased by a family is not satisfactory, the family will purchase a gallon from a competitor. Consider a week in which A families have purchased juice A, B families have purchased juice B, and C families have purchased juice C. Assume that families that switch brands during a period are allocated to the remaining brands in a manner that is proportional to the current market shares of the other brands. For example, if a customer switches from brand A, there is probability B/(B + C) that he will switch to brand B and probability C/(B + C) that he will switch to brand C. Suppose that the market is currently divided equally: 10,000 families for each of the three brands. a. After a year, what will the market share for each firm be? Assume pA = 0.10, pB = 0.15, and pC = 0.20. (Hint: You will need to use the RISKBINOMLAL function to see how many people switch from A and then use the RISKBENOMIAL function again to see how many switch from A to B and from A to C. However, if your model requires more RISKBINOMIAL functions than the number allowed in the academic version of @RISK, remember that you can instead use the BENOM.INV (or the old CRITBENOM) function to generate binomially distributed random numbers. This takes the form =BINOM.INV (ntrials, psuccess, RAND()).) b. Suppose a 1% increase in market share is worth 10,000 per week to company A. Company A believes that for a cost of 1 million per year it can cut the percentage of unsatisfactory juice cartons in half. Is this worthwhile? (Use the same values of pA, pB, and pC as in part a.)arrow_forward
- A new edition of a very popular textbook will be published a year from now. The publisher currently has 1000 copies on hand and is deciding whether to do another printing before the new edition comes out. The publisher estimates that demand for the book during the next year is governed by the probability distribution in the file P10_31.xlsx. A production run incurs a fixed cost of 15,000 plus a variable cost of 20 per book printed. Books are sold for 190 per book. Any demand that cannot be met incurs a penalty cost of 30 per book, due to loss of goodwill. Up to 1000 of any leftover books can be sold to Barnes and Noble for 45 per book. The publisher is interested in maximizing expected profit. The following print-run sizes are under consideration: 0 (no production run) to 16,000 in increments of 2000. What decision would you recommend? Use simulation with 1000 replications. For your optimal decision, the publisher can be 90% certain that the actual profit associated with remaining sales of the current edition will be between what two values?arrow_forwardPlay Things is developing a new Lady Gaga doll. The company has made the following assumptions: The doll will sell for a random number of years from 1 to 10. Each of these 10 possibilities is equally likely. At the beginning of year 1, the potential market for the doll is two million. The potential market grows by an average of 4% per year. The company is 95% sure that the growth in the potential market during any year will be between 2.5% and 5.5%. It uses a normal distribution to model this. The company believes its share of the potential market during year 1 will be at worst 30%, most likely 50%, and at best 60%. It uses a triangular distribution to model this. The variable cost of producing a doll during year 1 has a triangular distribution with parameters 15, 17, and 20. The current selling price is 45. Each year, the variable cost of producing the doll will increase by an amount that is triangularly distributed with parameters 2.5%, 3%, and 3.5%. You can assume that once this change is generated, it will be the same for each year. You can also assume that the company will change its selling price by the same percentage each year. The fixed cost of developing the doll (which is incurred right away, at time 0) has a triangular distribution with parameters 5 million, 7.5 million, and 12 million. Right now there is one competitor in the market. During each year that begins with four or fewer competitors, there is a 25% chance that a new competitor will enter the market. Year t sales (for t 1) are determined as follows. Suppose that at the end of year t 1, n competitors are present (including Play Things). Then during year t, a fraction 0.9 0.1n of the company's loyal customers (last year's purchasers) will buy a doll from Play Things this year, and a fraction 0.2 0.04n of customers currently in the market ho did not purchase a doll last year will purchase a doll from Play Things this year. Adding these two provides the mean sales for this year. Then the actual sales this year is normally distributed with this mean and standard deviation equal to 7.5% of the mean. a. Use @RISK to estimate the expected NPV of this project. b. Use the percentiles in @ RISKs output to find an interval such that you are 95% certain that the companys actual NPV will be within this interval.arrow_forwardYou have 5 and your opponent has 10. You flip a fair coin and if heads comes up, your opponent pays you 1. If tails comes up, you pay your opponent 1. The game is finished when one player has all the money or after 100 tosses, whichever comes first. Use simulation to estimate the probability that you end up with all the money and the probability that neither of you goes broke in 100 tosses.arrow_forward
- Based on Kelly (1956). You currently have 100. Each week you can invest any amount of money you currently have in a risky investment. With probability 0.4, the amount you invest is tripled (e.g., if you invest 100, you increase your asset position by 300), and, with probability 0.6, the amount you invest is lost. Consider the following investment strategies: Each week, invest 10% of your money. Each week, invest 30% of your money. Each week, invest 50% of your money. Use @RISK to simulate 100 weeks of each strategy 1000 times. Which strategy appears to be best in terms of the maximum growth rate? (In general, if you can multiply your investment by M with probability p and lose your investment with probability q = 1 p, you should invest a fraction [p(M 1) q]/(M 1) of your money each week. This strategy maximizes the expected growth rate of your fortune and is known as the Kelly criterion.) (Hint: If an initial wealth of I dollars grows to F dollars in 100 weeks, the weekly growth rate, labeled r, satisfies F = (I + r)100, so that r = (F/I)1/100 1.)arrow_forwardThe Tinkan Company produces one-pound cans for the Canadian salmon industry. Each year the salmon spawn during a 24-hour period and must be canned immediately. Tinkan has the following agreement with the salmon industry. The company can deliver as many cans as it chooses. Then the salmon are caught. For each can by which Tinkan falls short of the salmon industrys needs, the company pays the industry a 2 penalty. Cans cost Tinkan 1 to produce and are sold by Tinkan for 2 per can. If any cans are left over, they are returned to Tinkan and the company reimburses the industry 2 for each extra can. These extra cans are put in storage for next year. Each year a can is held in storage, a carrying cost equal to 20% of the cans production cost is incurred. It is well known that the number of salmon harvested during a year is strongly related to the number of salmon harvested the previous year. In fact, using past data, Tinkan estimates that the harvest size in year t, Ht (measured in the number of cans required), is related to the harvest size in the previous year, Ht1, by the equation Ht = Ht1et where et is normally distributed with mean 1.02 and standard deviation 0.10. Tinkan plans to use the following production strategy. For some value of x, it produces enough cans at the beginning of year t to bring its inventory up to x+Ht, where Ht is the predicted harvest size in year t. Then it delivers these cans to the salmon industry. For example, if it uses x = 100,000, the predicted harvest size is 500,000 cans, and 80,000 cans are already in inventory, then Tinkan produces and delivers 520,000 cans. Given that the harvest size for the previous year was 550,000 cans, use simulation to help Tinkan develop a production strategy that maximizes its expected profit over the next 20 years. Assume that the company begins year 1 with an initial inventory of 300,000 cans.arrow_forwardAssume the demand for a companys drug Wozac during the current year is 50,000, and assume demand will grow at 5% a year. If the company builds a plant that can produce x units of Wozac per year, it will cost 16x. Each unit of Wozac is sold for 3. Each unit of Wozac produced incurs a variable production cost of 0.20. It costs 0.40 per year to operate a unit of capacity. Determine how large a Wozac plant the company should build to maximize its expected profit over the next 10 years.arrow_forward
arrow_back_ios
arrow_forward_ios
Recommended textbooks for you
 Practical Management ScienceOperations ManagementISBN:9781337406659Author:WINSTON, Wayne L.Publisher:Cengage,
Practical Management Science
Operations Management
ISBN:9781337406659
Author:WINSTON, Wayne L.
Publisher:Cengage,
Single Exponential Smoothing & Weighted Moving Average Time Series Forecasting; Author: Matt Macarty;https://www.youtube.com/watch?v=IjETktmL4Kg;License: Standard YouTube License, CC-BY
Introduction to Forecasting - with Examples; Author: Dr. Bharatendra Rai;https://www.youtube.com/watch?v=98K7AG32qv8;License: Standard Youtube License