
Concept explainers
Videos
(a)
To find: The
(a)
Answer to Problem 42E
Solution: The required
Explanation of Solution
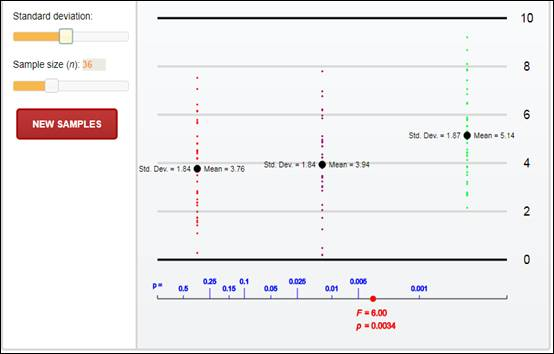
Calculation: Follow the below described steps to compute the F-statistic value using Applet,
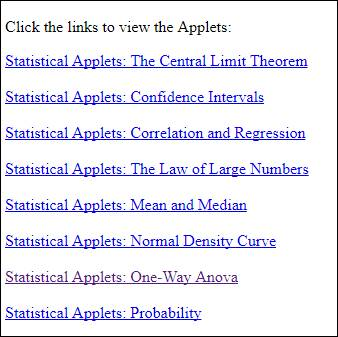
Step 1: To compute the F-statistic value select the option ‘Statistical Applets: One-Way Anova’ as shown in the screenshot below,
Step 2: The ANOVA window is displayed in the screenshot below,
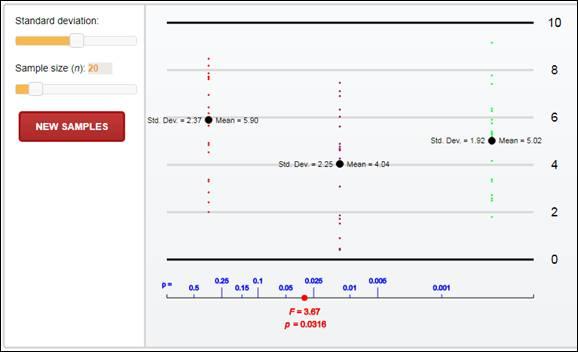
Step 3: In the ANOVA window that appears drag the black dots until the p-value at the lower side of the window is set as 0.01. On moving the black dots, the corresponding means, standard deviations,
On a few configurations, the p-value is set at
As is evident from the applet, the
(b)
To find: The changes in
(b)
Answer to Problem 42E
Solution: The
Explanation of Solution
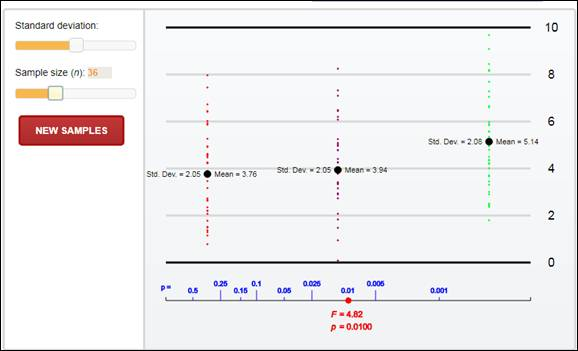
Calculation: Repeat Step 1 of part (a) and on sliding the standard deviations bar to the right, it is observed that there is a gradual drop in the
The corresponding
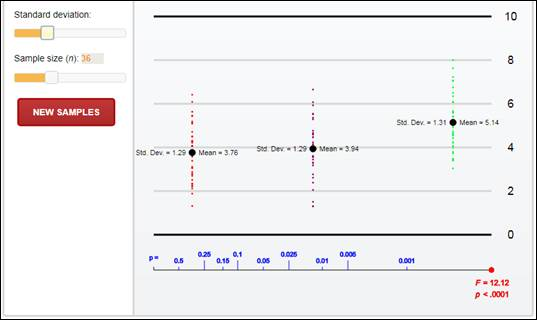
On sliding the standard deviation bar further to the right side, the following changes can be observed
The
On further adjustments,
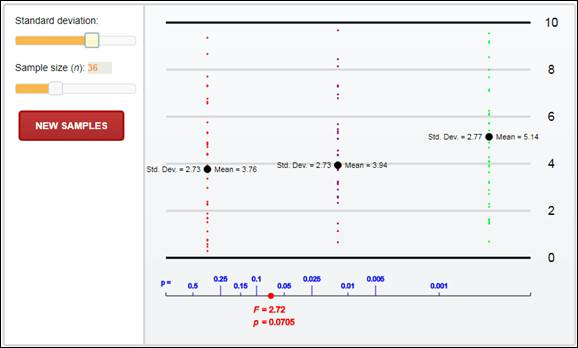
Interpretation: The
(c)
To explain: The reason for a change in
(c)
Answer to Problem 42E
Solution: The
Explanation of Solution
An increase in within the group variations leads to a drop in the
Considering the p-value, in case of variations between the groups, the p-value tends to be high accounting for a significant difference between the groups. In case of within variability if the variability is quite large, then p-value does not yield any relevant inference.
Want to see more full solutions like this?
Chapter 12 Solutions
ETSU PRACSTAT + SAP ACESS 12MO (LL)


 MATLAB: An Introduction with ApplicationsStatisticsISBN:9781119256830Author:Amos GilatPublisher:John Wiley & Sons Inc
 Probability and Statistics for Engineering and th...StatisticsISBN:9781305251809Author:Jay L. DevorePublisher:Cengage Learning
 Statistics for The Behavioral Sciences (MindTap C...StatisticsISBN:9781305504912Author:Frederick J Gravetter, Larry B. WallnauPublisher:Cengage Learning
 Elementary Statistics: Picturing the World (7th E...StatisticsISBN:9780134683416Author:Ron Larson, Betsy FarberPublisher:PEARSON
 The Basic Practice of StatisticsStatisticsISBN:9781319042578Author:David S. Moore, William I. Notz, Michael A. FlignerPublisher:W. H. Freeman
 Introduction to the Practice of StatisticsStatisticsISBN:9781319013387Author:David S. Moore, George P. McCabe, Bruce A. CraigPublisher:W. H. Freeman