
Concept explainers
Videos
(a)
Section 1:
To find: The degrees of freedom for the provided statistic.
(a)
Section 1:
Answer to Problem 11E
Solution: The degrees of freedom for groups is 4 and for observations is 25.
Explanation of Solution
Calculation: The degrees of freedom for groups is calculated as,
And the degrees of freedom for errors is computed as,
Section 2:
The critical values corresponding to calculated degrees of freedom.
Section 2:
Answer to Problem 11E
Solution: The
Explanation of Solution
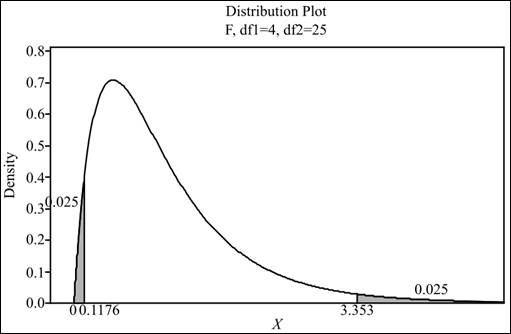
(b)
To graph: A distribution plot.
(b)
Explanation of Solution
Graph: To draw a probability distribution curve follow the below mentioned steps in Minitab,
Step 1: In a Minitab worksheet go to ‘Graph’ and click on Probability Distribution Plot.
Step 2: In the dialogue box that appears select ‘View Probability’ option and click OK.
Step 3: Next select the distribution as F and enter the corresponding numerator and denominator degrees of freedom in the respective fields and click on OK to obtain the required graph.
The graph obtained is attached below,
(c)
The p-value.
(c)
Answer to Problem 11E
Solution: The p-value will lie in between
Explanation of Solution
(d)
Weather all pairs of group means differ significantly or not.
(d)
Answer to Problem 11E
Solution: It is not necessary that all the group means are different. There may be a single mean that differs.
Explanation of Solution
Want to see more full solutions like this?
Chapter 12 Solutions
ETSU PRACSTAT + SAP ACESS 12MO (LL)


 MATLAB: An Introduction with ApplicationsStatisticsISBN:9781119256830Author:Amos GilatPublisher:John Wiley & Sons Inc
 Probability and Statistics for Engineering and th...StatisticsISBN:9781305251809Author:Jay L. DevorePublisher:Cengage Learning
 Statistics for The Behavioral Sciences (MindTap C...StatisticsISBN:9781305504912Author:Frederick J Gravetter, Larry B. WallnauPublisher:Cengage Learning
 Elementary Statistics: Picturing the World (7th E...StatisticsISBN:9780134683416Author:Ron Larson, Betsy FarberPublisher:PEARSON
 The Basic Practice of StatisticsStatisticsISBN:9781319042578Author:David S. Moore, William I. Notz, Michael A. FlignerPublisher:W. H. Freeman
 Introduction to the Practice of StatisticsStatisticsISBN:9781319013387Author:David S. Moore, George P. McCabe, Bruce A. CraigPublisher:W. H. Freeman