Videos
According to a Gallup poll, in 2012 almost a third of Americans named Iran their country’s greatest enemy. That number matched public sentiment in the United States toward Saddam Hussein’s Iraq at the time of the 2003 invasion. The line graphs show the percentage of Americans who considered either Iraq or Iran their country’s greatest enemy from 2001 through 2012. Use this information to solve Exercises 49-50.
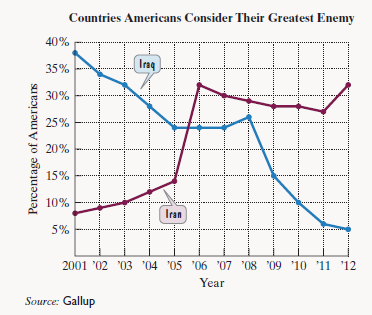
a. Find an estimate for the percentage of Americans who considered Iran their country’s greatest enemy in 2001.
b. Between which two years did the percentage of Americans who considered Iran their country’s greatest enemy increase at the greatest rate?
c. In which year did 12% of Americans consider Iran their country’s greatest enemy?
Want to see the full answer?
Check out a sample textbook solution
Chapter 1 Solutions
Thinking Mathematically (6th Edition)


- By examining the scatterplot, is there a relationship between the length of the arm span and the height of a person? Explain your answer (minimum of 3 sentences.arrow_forwardA group of students plotted the number of hours they worked at a cake shop during the holidays and the number of cakes they delivered in a week.Which statement best describes the relationship between the number of hours spent working at the cake shop and the number of cakes delivered? Greater hours worked, more cakes delivered Fewer hours worked, more cakes delivered Greater hours worked, fewer cakes delivered There is no relationship between hours spent working and number of cakes delivered.arrow_forward(Looking at the graph, we can see that the blue line, representing the population proportion in the USA, is consistently increasing over time and eventually reaches a value of around 0.33 (33%) after 100 years. In contrast, the green line, representing the population proportion in China, is decreasing over time and eventually reaches a value of around 0.67 (67%) after 100 years. The red line, representing the population proportion in Canada, remains relatively constant over time and has the lowest value among the three countries) By year 100, the USA has the highest proportion of the population, followed by China and Canada. Does my analysis correct ?arrow_forward
- How will you spend your average life expectancy of 78 years?The bar graph shows the average number of years you will devote to each of your most time-consuming activities.According to the American Bureau of Labor Statistics, you will devote 37 years to sleeping and watching TV. The numberof years sleeping will exceed the number of years watching TV by 19. Over your lifetime, how many years will you spend on each of these activities?arrow_forwardWhich statement correctly compares the rates at which Kevin and Christy save money?arrow_forwardCreate a line graph of the data using Excel. For how many of the years was the deficit greater than or equal to $320 million?arrow_forward
- The coaches of a group of debate teams answered a survey about hours of debate team practice and number of team wins. The graph shows the results of this survey. Based on these results, if a team practices 4 hours per week next season, which is the best estimate of the number of debates the team can expect to win? 1 12 16 20arrow_forwardAccording to a food website, the mean consumption of popcorn annually by Americans is 62quarts. The marketing division of the food website unleashes an aggressive campaign designed to get Americans to consume even more popcorn. Complete parts (a) through (c) below.arrow_forwardBased on the line graph shown, how did Google's stock price perform between March 2015 and August 2015?arrow_forward
- Refer to the graph below and answer What percent of the land is not included in North America?arrow_forwardWhich graph has a line that represents the best fit for the recorded data?arrow_forwardBased on the model, what percent of people should have IQ scores above 116? What percent of people should have IQ scores between 68 and 84? What percent of people should have IQ scores above 132?arrow_forward
 Algebra: Structure And Method, Book 1AlgebraISBN:9780395977224Author:Richard G. Brown, Mary P. Dolciani, Robert H. Sorgenfrey, William L. ColePublisher:McDougal Littell
 Holt Mcdougal Larson Pre-algebra: Student Edition...AlgebraISBN:9780547587776Author:HOLT MCDOUGALPublisher:HOLT MCDOUGAL